Chapter 8 – Social Justice, Well-Being and Economic Organization
Coordinating Lead Authors:[1] Gianluca Grimalda, Kalle Moene
Lead Authors:[2] Hiroshi Ono, Fernando Filgueira, John Roemer, Reema Nanavaty, Katherine Gibson, Carol Graham, David Schkade
Word count: 44,959
Abstract: After having reviewed some of the most widely used empirical indicators of social justice and well-being, we discuss the shift from utilitarianism to egalitarianism in the philosophical debate on distributive justice, the Science and Technology Study and feminist approaches to social justice, and account for recent efforts in empirically mapping subjective well-being. We draw on these approaches to evaluate the efficacy of different economic systems in bringing about social justice and well-being. Among other things we focus on the experience of the Nordic countries in achieving high levels of economic development combined with social equality. We argue that the basic tenets of their model can be used in developing countries. The problem is not economic feasibility, but maybe political feasibility. In particular, we explore how egalitarian wage compression can enhance technological innovation and productivity, and how welfare spending may fit well into a progressive development strategy even in poor countries. We also discuss concrete examples of ownership models alternative to the standard capitalistic model. Our analysis then reviews the linkages between economic development and cultural change, asking whether the “social ethos” that seems to be a key ingredient of successful models can be somehow “implanted” in developing economies. We end our chapter with some thoughts on what appears to be the main challenging issues for social justice in the 21st century and beyond.
Summary
The most widely used empirical indicators of social justice and well-being provide a mixed picture of the world. On average there is social progress at the global level. Global inequality appears to have taken a decreasing trend in the mid-2000s for the first time since the beginning of the 19th century. Yet the gaps between the richest and the poorest countries and the richest and poorest households remain staggering. We wonder whether the general economic scenery may become less favorable to global social progress in the coming years, as the wealth of the top 1% of the population is rising in most countries and the top 5% of population in the world have experienced some of the largest gains.
Principles of fairness must be taken seriously to judge these disparities. We provide an overview of the most recent debate over theories of distributive justice in political philosophy. The general consensus has shifted from a utilitarian view of justice to an egalitarian view, where equality of primary goods, capabilities, resources, or opportunities – depending on which perspective is taken - should be guaranteed. The condition of the most disadvantaged in society, rather than its average member, now occupy center stage. Other approaches advocate the liberation of people oppressed by economic or social relationships in capitalist regimes as the basis for social justice.
Empirically, the measurement of subjective well-being over long time spans has revealed some disconcerting truths. In spite of consumption having increased at least threefold in some rich countries since the 1950s, the increase in average subjective well-being has been virtually absent. Moreover, the disappearance of social safety nets associated with institutional changes in transition economies has considerably deteriorated subjective well-being. These findings point to the dependence of subjective well-being from social and institutional conditions.
We use the principles of justice and well-being to understand the consequences of what we call the real competition. This competition takes place also in non-market areas, including institutions and organizational design as well as in politics and between economic systems. In contrast to the personal incentives, individual solutions and short-sightedness of ideal competition, real competition often rewards complementary gains such as cooperation, trust, and long-term thinking. This is why global competitive forces can induce social equality that revolutionizes the political and economic structure from within.
Comparing a wide range experiences in small and large countries from Russia to South Korea and from Scandinavia to Latin America, we explore system competition varying from socialism vs. capitalism to politics vs. markets, including dictatorships with and without markets; and markets with and without a social ethos and social democratic features.
In reviewing some of the most important mechanisms to enhance social justice and well-being we emphasize that there are several ways to achieve social progress. One can i) take wage determination out of market competition and place it into a system of collective decision making, ii) expand the welfare states at the national level, especially the universal welfare programs, iii) provide a national basic income system that frees workers from the slavery of capitalist relationships, iv) transform the structure of property relations and capitalist relations that reclaims the need for collective forms of property, v) stimulate worker cooperatives where the direct producers in each enterprise make all major decisions and share the revenues, vi) work for a new global order with a supranational state that is able to tax, regulate and redistribute capital and income (which can of course include a basic global income) across national borders.
We recommend that social equality in one form or another can be used as a development strategy. There may be a strong complementarity between markets and social intervention emphasizing equality, participation and of social justice. It is important both to use markets and to tame their forces somewhat by democratic polices and countervailing power.
In particular we explore how wage compression induces modernization, innovation and higher productivity. We show how the development gaps between the most modern and the least modern technology in use is determined by how much labor earnings are compressed across workers. These development gaps vary widely across countries. Many think that the US has the most modern economy and should be used as a benchmark against less modern and less efficient economies in say India and China. We demonstrate, however, how the development gap is much higher in the US than in the egalitarian Nordic countries. Social equality provides a more efficient economy. The development gaps again feed-back to sustain the compressed earnings distribution.
Likewise we demonstrate how a welfare state arrangement can be used to enhance capabilities, empower weak groups with inefficiently low earnings, and help the millions that go hungry even in good years. A welfare state can have strong long run effects for productivity and well-being. It may also give rise to a social multiplier at the individual level and to a social equality multiplier at the society level that magnify initial impulses. We also review reasons why any good development path must have continuous redistribution.
One prominent experience in achieving high levels of economic development combined with social equality stems from the Nordic countries. We argue that the basic tenets of their model can be used in developing countries. The problem is not economic feasibility, but maybe political feasibility. Finally, we warn that it is not easy to implant from above or from outside the “social ethos” that seem to be a key ingredient of successful models. Although economic development, over the long run, seems to go hand-in-hand with rising concerns for the society rather than one’s own material conditions, culture seems to exert long-lasting influences on this path. We end our chapter with some thoughts on what appears to be the main challenging issues for social justice in the 21st century and beyond
1. Introduction
The bourgeoisie, during its rule of scarce one hundred years, has created more massive and more colossal productive forces than have all preceding generations together. Subjection of Nature’s forces to man, machinery, application of chemistry to industry and agriculture, steam-navigation, railways, electric telegraphs, clearing of whole continents for cultivation, canalisation of rivers, whole populations conjured out of the ground – what earlier century had even a presentiment that such productive forces slumbered in the lap of social labour? (Karl Marx and Friedrich Engels, Communist Manifesto)
‘’Can capitalism survive? No. I do not think it can’’ - wrote the conservative economist Joseph Schumpeter in his 1943 book ‘’Capitalism, Socialism, and Democracy’’ (p 61) - and added ‘’Can socialism work? Of Course it can’’ (p 167). While this view must have been shared by many people hundred years ago, it is held by almost nobody today. Instead capitalism is associated with the end of history.
But it should not. Whether alternative systems can work or not may seem irrelevant to most people today. Yet, to explore feasible alternatives may be one of the most important issue in the social sciences today. Even those who believe that global capitalism is particularly ugly, unequal, inhumane and unable to provide lasting benefits to the majority of the world’s population, condemn the system without having a clear picture of what could be the alternative. So the most ardent critics of the social injustice under capitalism are far from most precise in prescribing feasible alternatives.
In the 18th and 19th century, in contrast, critics saw both the progressive sides of capitalism as well as the ugly ones. Some of them defended the system, others attacked it. Common for most of them were their sympathies with the poor segments of society. This is actually an inherent content in modernization theories that originated in the Enlightenment era (Inglehart and Welzel, 2006). They built on the belief that technological progress gives humanity increasing control over nature and that this would be accompanied by cultural change and new value systems (Condorcet, 1795). Modernization theories were also characterized by the idea that such changes are conducive to social and human progress.
Adam Smith, of course, saw many benefits of markets and capitalism. Yet he clearly identified the unequal power, social misuse, and the intolerable inequality of income in the capitalist system. In fact, the entire book, Wealth of Nations, can be read as an attack on the commercial system in England. First of all, Smith was morally concerned ‘’It is but equity, besides’’, he insisted, ‘’that they who feed, cloath and lodge the whole body of the people, should have such a share of the produce of their own labour as to be themeselves tolerably well fed, cloathed and lodged’’ (WN, Book I, Ch. VIII, p. 88). Secondly, inequality to Smith was a form of oppression: ‘’For one very rich man there must be at least five hundred poor, and the affluence of the few supposes the indigence of the many’’ (WN, Book V, Ch. I, p. 232). Thirdly, Smith was skeptical of governmental interferences – not so much for the reasons that are so much used to day, but simply because interventions tended to favor the rich over the poor. He stated, for instance, that we ‘’have no acts of parliament against combining to lower the price of work; but many against combining to raise it’’ (WN, Book I, Ch. VIII, p. 74). So, clear defenders of capitalism, like Adam Smith, were also the most serious critics of the system.
Similarly, the most ardent critics of capitalism, such as Karl Marx, were also heavily impressed by the social progress and the productive improvements that the system offered. Marx was convinced that capitalist dynamics and the political clout of the bourgeoisie led to revolutionary changes in the economy, in politics, and in society at large – as ‘’by the rapid improvement of all instruments of production, by the immensely facilitated means of communication, [capitalism] draws all, even the most barbarian, nations into civilisation.’’ Yet, he insisted, it should be replaced by a distinct alternative - socialism.
Why was he heralding sides of the system, but yet announcing an abrupt end to it? One reason was that the capitalist mode of production was reaching the end of its progressive period, in his view, and that it would be toppled and replaced with a new system of property relations that would foster the further development of technology, labor productivity, and human flourishing. In this revolutionary transformation, capitalist workers, who own no capital, become workers who jointly own the capital stock of the country. The private and highly concentrated ownership of capital characteristic of capitalism would come to fetter technological development, and would be replaced by some kind of social or public ownership of capital. In the end of their manifesto Marx and Engels provide some clues as to what they believed where necessary changes in the relations of production, and how the state and revolution should bring them about.
1. Abolition of property in land and application of all rents of land to public purposes. 2. A heavy progressive or graduated income tax. 3. Abolition of all rights of inheritance. 4. Confiscation of the property of all emigrants and rebels. 5. Centralization of credit in the hands of the state, by means of a national bank with State capital and an exclusive monopoly. 6. Centralization of the means of communication and transport in the hands of the State. 7. Extension of factories and instruments of production owned by the State; the bringing into cultivation of waste-lands, and the improvement of the soil generally in accordance with a common plan. 8. Equal liability of all to work. Establishment of industrial armies, especially for agriculture. 9. Combination of agriculture with manufacturing industries; gradual abolition of all the distinction between town and country. 10. Free education for all children in public schools. Abolition of children’s factory labor in its present form. Combination of education with industrial production.
Most of these at the time rather radical suggestions have actually been implanted later, many of them during the 20th century, especially in the period after World War II. The delays teach us an important lesson. Reforms that in a period sound radical and even utopian, can easily become politically feasible and even sound like mainstream in later periods. Indeed, agrarian reforms, progressive taxation, inheritance taxes, state property of means of transport and credit, free public education for all children, some national factories, workshops, railroads and shipyards were all implemented. Several of the reforms undertaken in the same fashion were not even considered by the 19th century revolutionaries: public health care, nationally financed pension systems, state monopoly or dominant position in the production of basic utilities (water, communications, electricity).
The countries that perhaps went furthest in implementing egalitarian reforms and institutional changes are located in the north of Europe and in particular in Scandinavia. Surprisingly to some, their model of social democratic development actually owes more to Adam Smith than to Karl Marx. The intellectual inspiration from Smith is not direct, though. But both Smith and the social reformers in Scandinavia fought for the interests of the poor and saw modernization and expansion of markets as the key to escape poverty. Both saw the primary task as removing obstacles to rapid modernization --- Adam Smith pointed at the guild privileges and the monopolies that limited the size of the market, the social democrats pointed at the strong local unions whose wage premiums restricted the expansion of the most productive sectors[3].
What distinguished the social democrats from more conservative followers of Adam Smith like Margaret Thatcher was the solution to the problem of restricting the power of local unions. While Thatcher's solution was to weaken unions as institutions, the social democratic approach was to strengthen unions as institutions and to structure collective bargaining in a highly centralized manner that reduced the influence of high-paid workers in the wage setting process. The oppressing nature of economic inequality, as Smith saw it, was to some extent remedied by empowering weak groups in the labor market and of course by extending the franchise.
As the reforms were implemented well-being went up and a more just social order emerged by gradual changes. The 20th century, especially the 40-odd years after the World War II, saw the rise of the welfare state that empowered people, reduced inequality and transformed society even further. In general, combinations of capitalism and democracy are responsible for most of the 20th century advances in well-being and social justice. No other ‘model’ comes even close to achieving the desired goals to the same degree. And it is not built “on one size fits all” measures, as capitalism is harboring countries as different as the US and Sweden and as Switzerland and Japan.
Now, however, the heterogeneity has been under attack for a while. A renewed capitalist ideology, falsely claimed to take inspiration from Adam Smith, has triumphed. It attacks the most progressive arrangements. In practice it is built on a perception where not just self-interest, but also greed, fear and suffering are driving forces behind prosperity and efficiency in the economy. Most countries give in to the quest for deregulation of financial markets, labor markets, housing markets, capital markets – in addition to the quests for welfare state retrenchments and less progressive taxes. As a result inequality sky-rocks and the developmental state withers.
Globalization may still reduce some of the gaps between developed and the developing countries. But, if China and India are left out of the equation, the gaps in well-being between richer and poorer nations – even measured inadequately by per capita gross domestic product -- have gone up, not down --- and within countries inequality has gone up nearly everywhere. In addition to the dismal trends in inequality and social injustice, global capitalism face huge problems in producing material improvements without climate change, and actually in producing some sense of belonging and happiness in the population.
One lesson from all this is that a small change can make a huge difference. It can set forth cumulative changes. A minor regulation or deregulation, for instance, can lay the economic and political foundation for new more fundamental changes in the same direction. It can go both ways. The series of deregulations that we have recently seen in many countries, may mirror the cumulative reforms and institutional change that once established the local system.
Another lesson is that we - in a longer perspective - can easily underestimate the role of markets in egalitarian reforms and the capacity of democracy to transform capitalist institutions and production relations. The most progressive and successful social reformers have built on a dual view of capitalism - both its positive and negative sides. Obviously, it is not necessarily the reforms that aim at turning the system around that make the most fundamental changes. Rather those reforms that modify or change certain aspect of the system, and keep other aspects, are, as we shall return to many times below, most likely to improve performance and enhance the well-being of the population. Thus both Smith and Marx had it right when they were heralding some aspects of capitalism and fiercely warning against others.
In any case, the real question is no longer whether capitalism can survive - and whether socialism can work. Rather we should ask what is the feasible mix of markets and regulation, of social organization and individual autonomy, of social protection and capitalist dynamics, which work best as measured by well-being and social justice
There are several ideas of how to combine markets and social empowerment to enhance well-being – how one can create a more just society by confronting greed-driven global capitalism. One can:
- take wage determination out of market competition and place it into a system of collective decision making
- expand the welfare states at the national level, especially the universal welfare programs
- provide a national basic income system that frees workers from the slavery of capitalist relationships,
- transform the structure of property relations and capitalist relations that reclaims the need for collective forms of property,
- stimulate worker cooperatives where the direct producers in each enterprise make all major decisions and share the revenues,
- work for a new global order with a supranational state that is able to tax, regulate and redistribute capital and income (which can of course include a basic global income) across national borders.
In all these alternatives there may be a strong complementarity between markets and social intervention emphasizing equality, participation and of social justice. They can also be strengthened by combining some of them.
One specific victory today can lay the foundation for the implementation of other reforms tomorrow. It is important both to use markets and to tame their forces somewhat by democratic polices and institutional change.
Before we discuss all this in more detail we briefly go through some summary measures of the recent trends in well-being and social justice in section 2. Section 3 discusses the more fundamental questions of what is the just way to allocate resources, income and wealth in society. Section 4 evaluates from a historical perspective the ability of different economic systems to bring about social justice and well-being. Section 5 draws on the previous discussion and seeks to provide policy recommendations for both developing and developed countries in their quest for social progress. Section 6 concludes seeking to highlight the key challenges to achieve social progress in the 21st century.
2. An overview of the evolution of well-being and social justice worldwide
Together with the need to redress situations of social injustice and poverty comes the necessity to obtain measures for such notions that are internationally comparable and consistent over time. Indicators of social justice and well-being have become widespread, although universal coverage is quite rare. Undoubtedly, the human development index (HDI) developed by the United Nations since 1990 represents the most ambitious attempt to provide a nearly universal measure of levels of well-being around the world. The HDI comprises three dimensions that are deemed as basic for individuals to fully develop their capabilities: their health, level of education and material standards of living. Indicators for these dimensions are taken to be life expectancy, expected years of schooling and gross national income per capita (GNI); these indicators are standardized and combined with equal weights in a geometric mean (see Technical Notes to Human Development Report, p.2).
Figure 1 shows the evolution of the HDI from 1990 to 2015 for different groups of countries. Countries classified as having “Very high human development” – namely, HDI above 0.8 in 2015 – include mainly like Western European countries, the US, Canada and similarly developed countries. Countries belonging to the group of “High human development” - HDI between 0.7 and 0.8 in 2015 - are, for example, the Russian Federation, China and most countries in Latin America. India, some African countries and Central Asia have typically a ”Medium human development” - HDI of 0.55-0.7 in 2015. Finally, countries with “Low human development” – namely, HDI below 0.55 in 2015 - are mostly Sub-Saharan African countries.
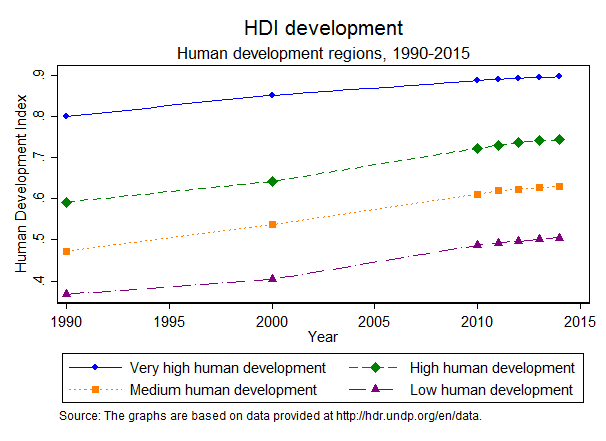
Figure 1. The evolution of the Human Development Index (HDI) by group of countries (1990-2015)
The graph tells a mixed story. On the one hand a steady trend of increasing HDI characterizes all four groups. The rate of growth of HDI seems even to accelerate, through rather modestly, after the year 2000. Nonetheless, the gap between these four groups, and in particular between the very high and low human development groups have decreased only marginally. In 1990 the gap equaled 0.433 of the index scale, whereas the gap was only 0.391 in 2015. A reduction of less than 10% of the gap after 25 years of constant global effort to reduce between-country disparities seem quite a modest improvement. Simply projecting these trends over the future reveals that full convergence between countries will only be reached in the year 2067. Figure 2 reports the HDI score in 2014 broken down by each of the three components and group of countries. Note that education is the one component where low human development countries rank the lowest.

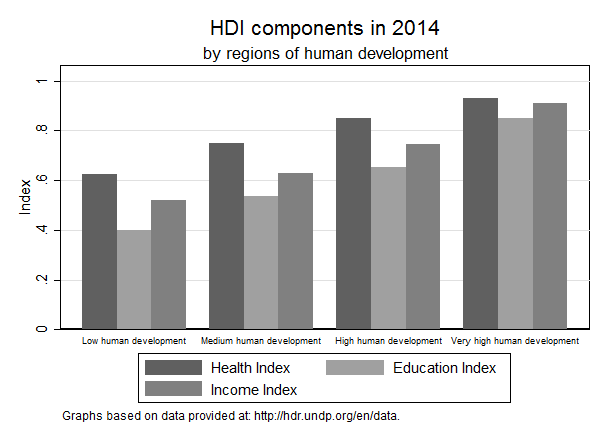
Figure 2: Human Development Index score per group of country and sub-indicator
Although recent approaches to measuring social justice tend to emphasize the relevance of equality of opportunities (see section 3, this chapter), the levels of inequality in income and wealth are widely used indicators to measure the extent to which a society can be considered as just. The interest in inequality has led to unprecedented efforts to put together long-run datasets that are now available for a broad range of countries (Piketty, 2014). The Gini Index is a widely used measure of country-level inequality, which considers the extent to which the cumulative distribution of income in a society differs from a perfectly egalitarian distribution of income. In particular, the index can range from a value of zero, indicating that each individual in the society owns an equal share of the income, to 100, which indicates that a single individual owns all the income in a society while all others own nothing.
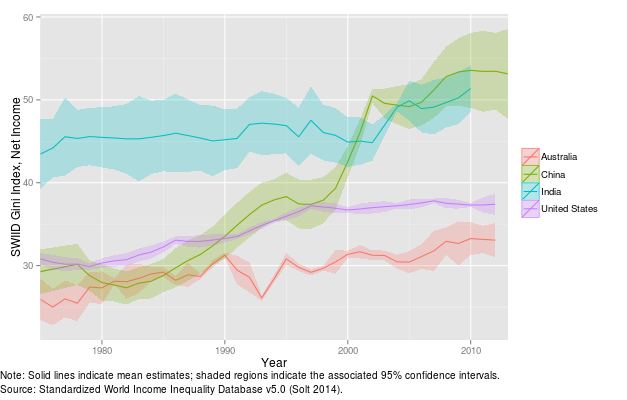

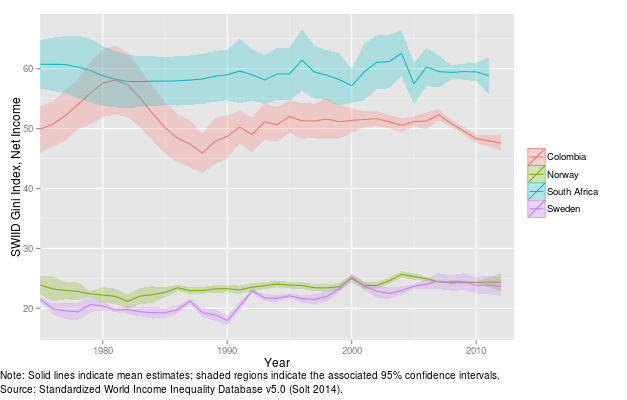
Figure 3. Evolution of the Gini Index for a selected sample of countries, 1970 - 2015
Figure 3 shows the evolution of the Gini index for a selected number of countries from 1970 to 2015, using inequality in net (post-tax, post-transfer) income. Data on the Gini index are notoriously difficult to compare internationally given the differences in the units of observations being used across countries. Here we use data from the Standardized World Income Inequality Database (SWIID), which has made a specific effort to construct an internationally-comparable dataset (Solt, 2016). Missing data for some years have been replaced by interpolations from other years. This is the reason why the graphs report confidence-interval bands to measure the precision of the estimate. These graphs show that inequality can be widely diverse between different countries. The Gini index has remained below a value of 30 over the whole period in Germany and some Scandinavian countries, but it has reached levels close to 60 in Zimbabwe and South Africa. What is more, inequality can change dramatically over time. This is apparent for China, which moved from levels of the Gini index below 30 during the 1980’s to levels above 50 after 2005. Inequality in Brazil and Colombia, two of the countries with historically highest levels of inequality, experienced a steady decrease in the last decades.
Another common approach to measuring economic cleavages is the share of income possessed by the top 1% in the income distribution. This measure only focuses on the ratio of income possessed by people at the top of the income distribution and all others. It is therefore not sensitive, unlike the Gini index, to variations in income shares for classes of income below the top 1%. It nonetheless has the merit of offering a stark comparison between income levels of the very rich people living in a society in comparison to all others. Figure 4 shows the evolution of the top 1% income share for a selected sample of countries.
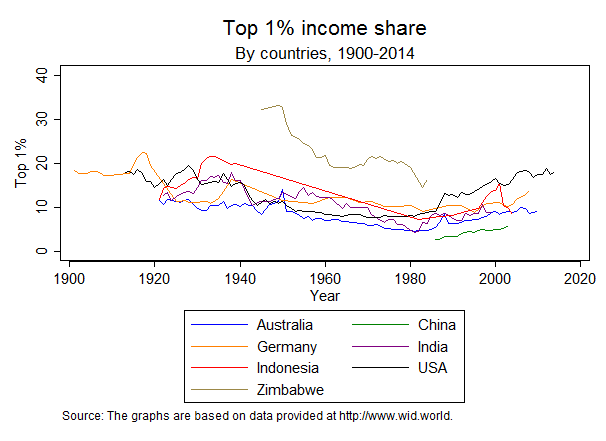

Figure 4. Evolution of the top 1 % income share by countries, 1990 - 2016
While the Gini index appears to evolve in different ways in different countries, the evolution of the top 1% income share shows remarkable similarities among the countries considered. Inequality experienced a decreasing trend up from the beginning of the 20th century until the 1980s, which was then reversed. Interestingly, countries for which complete coverage is not available – namely, China and Zimbabwe - show a trend that is similar to that of other countries for the period in which data are available. Such a “great U-turn” in inequality during the 20th century also holds for the share of wealth owned by the top 1% and has been the main focus of the well-known work by Piketty (2014). It is also interesting to note that China is still the country with the lowest share of income accruing to the top 1% in comparison to other countries in this group. At the other end, Zimbabwe stands out as the country with the highest level of income for the top 1%, although data are not available after 1984.
Recently assembled datasets also make possible to evaluate the evolution of global income inequality. Such datasets are to be considered with great caution. Particularly, the lack of nationwide household before the 1970s makes the assessment of within-country inequality nothing more than guesswork. Data are instead more reliable after the late 1980s.
| Panel A: Evolution of the global Gini index | Panel B: Relative gain in real per capita income by global income level, 1988-2008 |
|
|
|


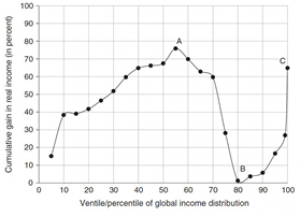
Figure 5: Evolution of global income inequality and recent trends in worldwide real per capita income
Source: Milanovic (2016)
Figure 5, Panel A shows the evolution of the global Gini index over a long time span. The tentative conclusion that can be reached is that only since the mid-2000s has global inequality started to decrease, mainly for the rapid development experienced by China and India. A steady rising trend characterized all previous years since 1820. Figure 5, Panel B offers an account of who have been the “winners” and “losers” of globalization. The graph plots the increase in per capita income for different percentiles of the global distribution of income over the period 1988-2008.
The graph shows that the income class that has gained the most comprises people in the middle of the global income distribution (point A in the graph). This is mainly formed by the emerging middle class in developing countries such as China in particular. According to Milanovic (2016), this rise in a “global middle class” is one of the defining features of the evolution of income distribution in recent decades. In contrast, people who appear to have gained the least are those belonging to the 80th percentile (Point B in the figure). These are mainly people occupying middle-lower classes within rich countries – in particular Western Europe and Northern America. Finally, the third defining fact of recent trends is the rise of “global plutocrats”. People occupying the top 5% of the income distribution have experienced massive gains in their incomes (Point C in the graph). These gains may be not as high as those characterizing people in 50% percentile in relative terms, but they are of course much larger if measured in absolute terms (see Milanovic, 2016, Figure 1.2). These graphs are quite telling, because changes in income relative to other income classes are often as important as the absolute income levels in determining people’s well-being (see section 2.7). The discontent of globalization losers may also be relevant to determine political outcomes.
Figure 6 shows the evolution of poverty rates over time, defined by the share of citizens with income below 1.90 US Dollars (expressed in purchasing power parity). It is noticeable that poverty rates have decreased steadily from the 1980s, from levels of around 40% to around 15%. Nonetheless, Sub-Saharan Africa is the region where progress has been the most sluggish. Still 50% of the people appear to fall below the poverty line in 2014.

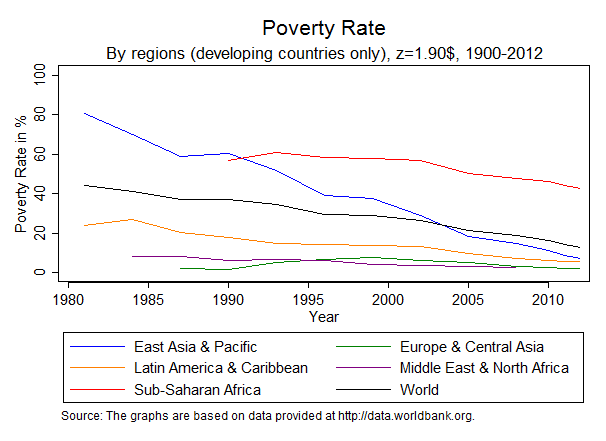
Figure 6: Evolution of poverty rates for the world and for regions
A useful measure combining information on both inequality and poverty is the Miser index, capturing to what extent poverty is unnecessary (Lind and Moene, 2011). This can be visualized as the product between the share of a country’s population that lives below the poverty line and the income difference between the average income of the non-poor and the average income of the poor. It can thus be interpreted as the total income gap by which the income of the poor falls below the average income of the non-poor (Lind and Moene, 2011). Figure 7 shows the evolution of the Miser index from 1990 to 2014, for a poverty line of 1.25$ in purchasing power parity. The different lines indicate various geographical regions. The Index is limited to developing countries that have a non-negligible share of people lying below the poverty line.

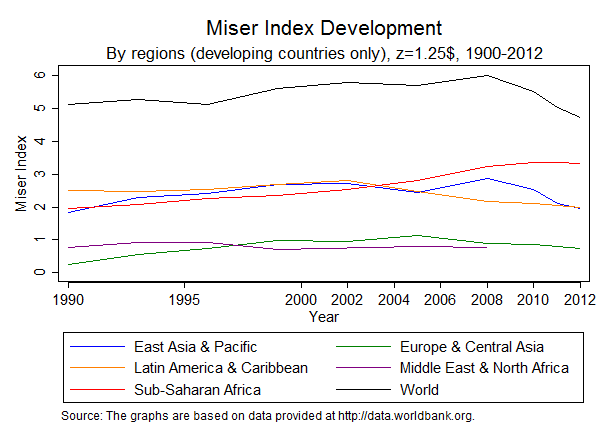
Figure 7: Evolution of the Miser Index
Figure 7 shows a steady increase of the Miser index for all regions from 1990 until 2005. Since then, the Miser index has decreased for all regions except for Sub-Saharan African countries, whose index has instead continued to grow. Interestingly, the Miser index applied to the whole set of countries has decreased in the last observed year to the lowest level since 1990.
Inequality of opportunity is central in our theoretical analysis of principles of redistribution (see section 3.5). The debate over how to best measure “opportunity” is wide-ranging. Although this is only a very rough measure of opportunity, many studies use the inter-generational elasticity of income. This measures the correlation between a person’s permanent income and that of their parents. This measure has the merit of assessing how much a person’s permanent income gets transmitted across generation, thus offering an evaluation of how much a person from lower economic strata has chances to climb up the economic ladder. It is however a rather imperfect measure of opportunity both because it overlooks other non-economic aspects of opportunity, and because it looks at the final outcomes of being endowed with opportunities rather than at the initial stage of distribution of opportunities. Recently, new composite indicators of opportunities have been created, which take into account both the availability of specific services (such as education, but also electricity and water resources) to children living in a certain society (or in a specific group of that society), and the distribution of a well-being indicator (such as income, earnings, or consumption) available to individuals belonging to specific groups of the society (see Brunori et al., 2013). Figure 8 reports charts detailing the existence of a strong correlation between measures of income inequality and both the inter-generational income elasticity (Panel A) and a composite index of inequality of opportunity (Panel B). Although these charts cannot disentangle causality issues, they highlight how certain economic systems appear capable of ensuring social justice under several different domains.
| Panel A: Relationship between income inequality and inter-generational income elasticity | Panel B: Relationship between income inequality and a composite index of inequality of opportunity |
|
|
|
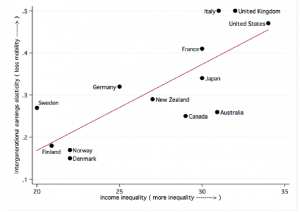
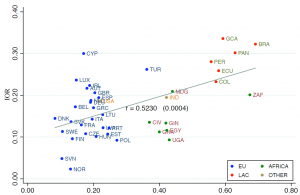
Figure 8: Relationship between income inequality, inequality of opportunity and intergenerational mobility elasticity
Source: Brunori et al., (2013) for Panel A; Corak (2013) for Panel B. IOR is an index of inequality of economic opportunity, as reported in Brunori et al. (2013).
Overall, this brief account of indicators of social justice and well-being supports the view that, within a general picture of generalized progress at the global level, there still exist large gaps between the richest and the poorest countries. The gap in the HDI and in poverty rates appear to be particularly conspicuous in spite of global efforts to reduce them. Moreover, the nearly universal rise in the concentration of wealth in the top 1% of the distribution, together with the fact that the top 5% of the income distribution experienced some of the largest gains over the last two decades, make us wonder whether the general economic scenery may be less favorable to global social progress in the coming years than it has been thus far.
After this general overview of trends in social justice and well-being, our analysis now turns to a review of principles of justice and to an account of recent efforts in empirically mapping subjective well-being.
3. Visions of Social Justice and Well-Being
Any system of politico-economic institutions will result in an allocation of resources, income and wealth. We should evaluate the efficacy of these institutions by asking not only their efficiency but also how just or fair that allocation is. This topic has been the subject of political philosophy and economics for hundreds of years, but a particularly active discussion of it took place in the last third of the twentieth century, initiated by the publication of John Rawls’s A theory of justice in 1971.
3.1 Utilitarianism
Until Rawls’s work, the predominant theory of justice that had been inherited from the nineteenth century was utilitarianism associated particularly with the work of Jeremy Bentham and John Stuart Mill. Utilitarianism is the view that the just allocation can be described as the one that would maximize the sum of ‘utility’ in a population, where a person’s utility is a measure of his subjective well-being. In the simplest version, a person’s utility is an increasing and concave function of individual wealth or income: concavity means that individuals obey the law of diminishing marginal utility. If one assumes that everyone’s utility function of money is the same, then maximizing total utility requires equalizing the money wealth of everybody, and for this reason, utilitarians like J.S. Mill were to some degree egalitarians.
In the twentieth century, however, philosophers and economists came to emphasize the differences between persons’ utility functions, and hence utilitarianism no longer coincided with egalitarianism. Indeed, utilitarianism requires that resources go in greatest amounts to those who can most effectively process them into well-being.
The inference that it is better to equalize incomes (if everyone has the same utility function) assumes that the amount of income produced in a society is independent of its distribution. But this is not true: the rule for income distribution will affect how much is produced. Thus the incentive problem, that the total product will be affected by how that product is distributed, must be addressed.
Even under the simplifying assumption that there is a fixed total pie to be distributed we see that a major problem with utilitarianism is that it recommends allocating the greatest share of resources to the ‘talented,’ those who are good utility-producing machines. Its concern is only with the sum total of well-being produced, with no specific concern for the boundaries between individuals.
This view is particularly pernicious when applied to intergenerational justice. If early generations invest a large share of their resources, inducing a high rate of technological change, that will augment the utility-producing capacities of later generations. Utilitarianism in the inter-generational context recommends allocating resources over time to maximize the sum of utilities of all generations. But this might require large investment and low consumption by early generations in order to produce hugely efficient utility producers in later generations. Clearly, this cannot be just.
3.2 Rawls’s difference principle
Rawls’s task was to dethrone utilitarianism as the dominant theory of justice, and to replace it with a kind of egalitarianism. But Rawls did not recommend equality of utility or well-being: rather he advocated equalizing the bundles of ‘primary goods’ distributed to persons in a society. Primary goods are those goods that are necessary for carrying out any plan of life, so Rawls said.
But, taking into account that goods need to be produced, equalizing the bundles of primary goods might require a system of taxation that might reduce the incentives for highly skilled people to work hard. In a compromise induced by this incentive problem, Rawls modified his recommendation to distribute primary goods in that way that maximized the bundle of them received by those who received the smallest bundle. This recipe is Rawls’s ‘difference principle,’ also known as the maxi-min distribution – that allocation that maximizes the amount which the least well-off group in the population receives.
Why did Rawls not call for maximizing the minimum utility in the population? For Rawls, a person’s utility is defined by the success she achieves in realizing her plan of life – to be specific this is how Rawls defined happiness. But plans of life, for Rawls, are choices of individuals, and the state’s responsibility (or the purview of justice) is to see that people have the wherewithal to implement their plans, not to guarantee that plans are implemented with equal success. His emphasis on primary goods follows from these considerations.
3.3 Sen’s capability approach
In 1980, Amartya Sen criticized Rawls for being too concerned with the allocation of goods, instead of the concern with what goods can do for people. One might have said that goods produce utility, but Sen located a precursor to utility that he called functioning: goods allow persons to function in various ways, and functionings are the real inputs into life success. The idea is thus to evaluate a person's well-being and advantage in terms of her or his ability to do valuable acts or reach valuable states of being: to be well nourished, to read, to eat, to love and be loved, to achieve self-respect and self-esteem, to be able to reason, to have friends, and so on. The “capability set” of a person is then defined as the alternative combinations of functionings this person is able to achieve. Sen advocated equalizing the capability sets of individuals. Sen, however, never proposed how to measure when one capability is bigger or better than another: thus, he does not, strictly speaking, have a complete definition of justice.
One goal of social progress is thus to develop people's capabilities so that they can flourish and enjoy such functionings. Yet, any policy which aims at this goal must also be sensitive to whether achieved functionings are free from risk or not. It is important to people that they enjoy a certain level of functioning and that they are able to sustain it over time. It is not only the lack of functioning, but also this lack of secure functionings which make these people disadvantaged. For instance, being unemployed one lacks the functioning of work; being employed as a casual worker one lacks the secure functioning of work. In other words, not only is it important that people have the capabilities to achieve functionings, but also that they are free from the anxiety and worry associated with that such a functioning may be at risk.
Functioning in domains facing risk is associated with a ‘corrosive disadvantage', where a disadvantage in one domain is likely to spread its effects to other domains – from hunger to unbearable debt for instance. On the other hand, ‘fertile functioning’ can be said to occur when achievement in one domain carries over benefits to another domain. Friendship helps people to secure their health and also their jobs. People who have strong social ties or, in Nussbaum words, “affiliations”, were more likely to find job once they became redundant compared with people who did not have strong social ties. The most disadvantaged in society are those who experience a clustering of several disadvantages and who therefore find it most difficult to get out of poverty unless the ties between these disadvantages are broken. Progressive policies should prevent corrosive disadvantages and sustain fertile functionings.
3.4 Dworkin’s responsibility cut
In 1981, Ronald Dworkin introduced another dimension into the discussion – or rather, he amplified an issue that Rawls and Sen had treated only tangentially and imprecisely. Dworkin, as had Rawls and Sen, wanted to distinguish between the goods or resources available to persons and their choices, which would lead (in Rawlsian parlance) to a degree of success in a plan of life. Now Dworkin argued that a person should be responsible for his choices, and hence it was not the business of egalitarian justice to be concerned with life-plan or well-being equality, but rather simply with equalizing resources available to persons.
However, unlike Rawls and Sen, Dworkin defined resource bundles comprehensively – to include not only transferable resources like money and wealth, but also non-transferable ones, like the family into which a person is born, or even his genetic make-up. So equalizing resources consisted in finding the allocation of transferable resources (wealth) that would compensate persons properly for the inequalities in their bundles of non-transferable resources (family backgrounds, perhaps, being the most important of these).
How could one decide on what the ‘right’ compensation is? Here, Dworkin proposed a clever scheme, a thought-experiment. He imagined that a veil of ignorance denied persons of the knowledge of the resource bundles that they would be assigned in the ‘birth lottery,’ and that behind this veil they could purchase insurance against bad luck in that lottery. In this hypothetical insurance market, persons used their actual preferences over risk, but were endowed with an equal amount of money with which to purchase insurance. Thus, the participants in the Dworkinian insurance market were shielded from knowledge of the comprehensive bundle of resources they would receive in life, but could purchase insurance against bad luck in that hypothetical lottery.
Any insurance market implements a transfer of money from those who were lucky to those who were unlucky. (For instance, those whose houses do not burn down transfer money to those who houses do burn: this is implemented through the payment of insurance premiums by the lucky ones, and the receipt of payouts by the unlucky ones.) And so this would occur in Dworkin’s thought experiment. After the birth lottery occurs, and the ‘souls’ who participated in the insurance market become persons located in families, transfers of wealth would occur to implement the insurance contracts that had been made. Those who were lucky in the birth lottery would transfer wealth to those who were unlucky and had insured against bad luck. Dworkin defined the ensuing allocation as the one that equalized resources.
Dworkin’s scheme was ingenious, but it turned out to have a fatal flaw. John Roemer pointed out (in 1985) that unless everyone were very risk averse, the insurance market could result in the accumulation of more wealth by those who were ‘talented’ – it could result in transferring wealth from the ‘handicapped’ to the talented, or from the unlucky to the lucky. This could happen because there are two competing interests that a ‘soul’ faces in deciding on what outcomes of the birth lottery she wishes to insure against: on the one hand, she wants to avoid penury, and thus to collect payouts of insurance if she is born poor or handicapped, but on the other hand, she wishes to have enough wealth to have a really successful life if she happens to be born talented and into a family with resources. If the soul is not very risk averse, the second consideration may dominate the first one, and Dworkin’s insurance market can result in transferring resources into the pocketbooks of the talented and fortunate, rather than the other way around.
There are two ways around this somewhat paradoxical result: either to assume that everyone in society is very risk averse – or would be when making the kind of decisions required being Dworkin’s veil of ignorance – or to jettison the veil-of-ignorance approach. It is unrealistic to take the first path: there is much evidence that, although most people are risk averse, they are not so risk averse as to prevent the unpleasant outcome that Roemer pointed out from occurring. Roemer later (1993) proposed a variation on Dworkin’s proposal that deleted the veil-of-ignorance thought experiment, but preserved the distinction between one’s resources and one’s choices that Dworkin had introduced.
3.5 Equality of opportunities
In 1989, Richard Arneson and G.A. Cohen, two political philosophers, each contributed further to the debate on egalitarian justice. Arneson argued that Dworkin was correct to make a distinction between choice and resources, but said that ‘equalizing resources’ should not be the objective – rather, it should be equalizing opportunities for welfare or well-being. Preferences would enter in what path a person chose once such opportunities were equalized. Cohen argued that Dworkin had improperly placed the ‘cut’ between resources and preferences. The right cut was between aspects of a person’s situation for which he should not be held responsible and aspects for which he should be held responsible. In particular, a person should not be held responsible for choices that were induced by preferences that were induced by circumstances beyond his control. If a person grows up in a poor family and neighborhood, has bad experiences in school as a result, and develops a preference against further education, should he be held responsible for the choices that ensue regarding his education? Cohen said no, but Dworkin maintained that responsibility for choices should be maintained as long as the individual identified with his preferences.
Dworkin suggested ‘equalizing resources’ rather than well-being, because of the problem of expensive tastes. A person who has expensive tastes should not, at the bar of justice, receive extra resources to satisfy them, and this counts against a theory of equality of welfare. But consider expensive tastes that are involuntarily induced in persons. A linguistic minority in a community may want their children to learn the parents’ language in the public schools. This is an expensive taste: but should justice ignore their demand? Dworkin’s argument would say yes, but Cohen’s no, because the expensive taste in this question is not something cultivated, but unavoidable.
Based upon this discussion, Roemer proposed (in 1993) a theory of equality of opportunity, proposing a partitioning society into types. A type consists of all persons who have similar circumstances – attributes of their social, physical and genetic environments that are beyond their control. The list of circumstances could be quite comprehensive, or fairly small. Within each type, under a given economic policy, there is a distribution of income. Where on this distribution a person sits can be caused by her choices or efforts: but the distribution of income of a type summarizes what the income opportunities are for the people of that type.
This approach is recently applied to Ecuador. In Figure 9, young male workers in Ecuador have been partitioned into seven types, defined only by the educational levels of their parents. Each curve is a cumulative distribution function of income of the set of workers whose parents have a given pair of educational levels. The curve furthest to the left is the cumulative income distribution function of male workers whose parents lack education entirely, and the curve furthest to the right is the income distribution of those workers whose parents have at least some tertiary education. Observe, for example, that the median income (0.5 quantile) of the first type is about 3000 pesos per annum, while the median income of the most advantaged type is about 12,000 pesos per annum. The stacking of these income distributions shows that, unequivocally, there is extreme inequality of opportunity for income acquisition in Ecuador, because a person’s opportunity for income is clearly closely related to his parents’ level of education. More equality of opportunity, in this case, would require that the differences between these cumulative distribution functions are reduced.
The example indicates that several choices must be made in discussing inequality of opportunity. First, what are the circumstances for which individuals should be compensated? In the Ecuador example, only one circumstance was considered – the educational level of the person’s parents. But one can expand this list considerably. That part of one’s income determined by ‘choice’ in this example emerges as the residual once circumstances are defined. So if one expands the list of circumstances to include other measures of disadvantage, the role of effort and choice will be diminished.
A society will thus determine what equality of opportunity means by the choice of circumstances it wishes persons to be compensated for. Equality of opportunity is therefore a concept that is defined as relative to the conception of circumstances and responsibility that a society wishes to adopt.
Salient questions are how much of income inequality is due to circumstances, and how much to differential choice? The answer depends upon what attributes of a person’s situation that are counted as circumstances. In the United States, for instance, a set of a broad set of circumstances (parental incomes, mother’s educational level, mother’s occupation, ethnicity, gender, rural vs. urban childhood, and height of the individual) would ‘account for’ 27 per cent of the income inequality. If in addition one includes a variety of other indicators (performance on reading and mathematics tests, a behavioral problems index, perceived quality of time spent with parents, two parents or single parent, smoking and drinking habits of parents), the resulting extended set of circumstances would account for fully 46 per cent of the income inequality. The extended list of circumstances would account 36 per cent of the income inequality in the UK.
We cannot indicate what role circumstances play in all countries because the relevant data have not yet been collected. However, for less comprehensive lists of circumstances, we can say that inequality of income opportunity is smallest in the Nordic countries and increases gradually as we move south in Europe to Italy, Spain, Greece and Portugal. In developing countries, inequality of opportunity is much greater still.
To summarize, the fertile discussion in political philosophy of the last 30 years of the twentieth century marked a move from the utilitarian view of justice to an egalitarian view. But whereas utilitarianism advocated the view of justice as the maximization of total well-being, the egalitarian view did not advocate equality of well-being but rather equality of primary goods, functionings and capabilities, resources, or opportunities, in its various versions. Thus the late-twentieth-century transformation from utilitarianism to egalitarianism was characterized by two features: first, a focus on the condition of the most disadvantaged in society, as opposed to the average member, and second, a focus on opportunities/resources available to people versus outcomes of well-being.
Needless to say, the theory of equality of opportunity has made huge progress, yet it is not a complete theory of justice. So far it does not consider political participation (democracy) and civil rights. Neither is it a complete theory of distributive justice as it does not address inequality of income as such, but only differential access to income. It is conceivable that we could have a society with virtually full equality of opportunity for income with respect to a comprehensive list of circumstances, but still considerable differences in income, and that would be undesirable, because it is probably impossible for people to treat each other as citizens with equal dignity if their material conditions are vastly different.
G.A. Cohen (2009) addressed this issue when he argued that the achievement of community among citizens requires limitations on the extent of income differences. Whether limiting income differences once equality of opportunity has been achieved should be considered an issue of justice or one of the decency of a society is an open question.
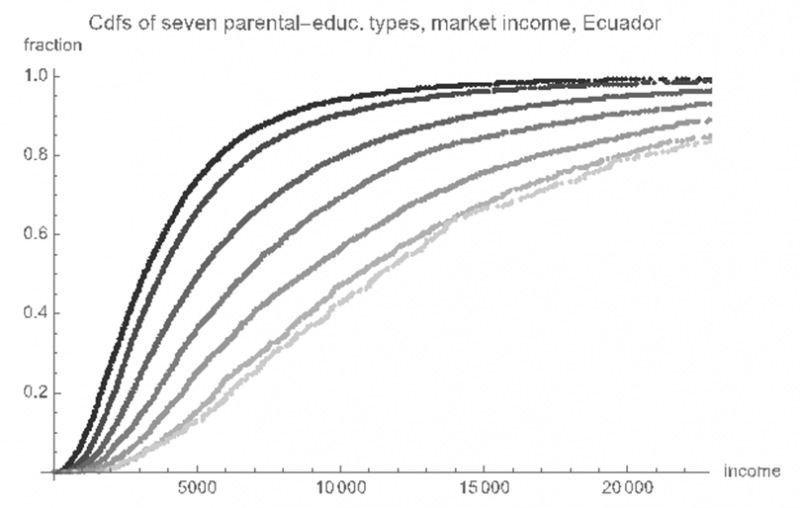
Figure 9. Cumulative distribution functions of income, male workers in Ecuador, partitioned into seven types based upon parental levels of education
3.6 An empirical review of perceptions of distributive justice
The theoretical literature we have reviewed above has also inspired empirical investigations examining which principles individuals use when making judgments on the fairness of a given earnings distribution. This strand of research comprises both “vignette studies”, where individuals are asked to rate the fairness of different hypothetical situations, and experimental studies, where individuals are asked to assess an actual allocation of earnings administered in a laboratory (or, in some cases, in real life) and propose a redistribution scheme from richer to poorer participants.
In spite of the differences that naturally arise across studies, the overwhelming consensus is that most people are indeed sensitive to individual relative responsibility in producing their earnings. First of all, full equalization of outcomes generally attracts little support when individuals are asked to evaluate earnings allocations. In the context of vignette studies (Schokkaert and Capeau, 1991; Konow, 1996), individuals would abide by an egalitarian principle only in the special case when those variables that are normally relevant for individual responsibility are perceived as having been equally applied. In survey studies, only between 3% and 7% of US respondents are in favor of complete or near equality of income (McCloskey and Zaller, 1984; Kluegel and Smith, 1986). To be sure, these studies do not address utilitarian theory as such, because the currency being redistributed is individual earnings. Nonetheless, a general lack of support for strict egalitarianism is evident.
Interestingly, very few people seem to adopt the Rawlsian difference principle either (see section 2.2). In a seminal experiment that purportedly reproduced Rawls’s original position, only one group out of 81 opted for the difference principle (Frohlich et al., 1987). Lack of compliance with Rawls’s difference principle has been confirmed in other studies using different methods (Konow, 2003; Schildberg-Hörisch, 2010). In general, most groups seem to reach consensus on a mixed rule, that is, to maximize expected income subject to a constraint on the minimum income, the so called Boulding hybrid principle (Boulding, 1962; Frohlich et al., 1987; Konow, 2003; Traub et al., 2005).
Second, and perhaps most importantly, individuals are clearly willing to reward individual effort or abilities when these are conducive to greater earnings. The amount of redistribution requested by experiment participants is considerably higher when luck, rather than individual effort, determines earnings (Durante et al., 2014), and individuals are willing to reward more those people who chose to work more (Konow, 2003; Cappelen et al., 2010). Nonetheless, Cappelen et al.’s (2007) pioneering study supported the view that people’s compliance with redistributive criteria cannot be reduced to a unique principle. Around 38% of participants can be classified, in the authors’ words, as “liberal egalitarians”. Those are people who compensate for inequalities caused by factors beyond one’s control – such as random differences in the wage rates – but do not compensate for inequalities that are caused by people’s choices – such as how much effort they put in the task. Nonetheless, a non-negligible portion of participants - about 18% – are classified as pure libertarians, as those people do not compensate for differences in luck. Perhaps surprisingly, the most numerous category in this experiment is formed by strict egalitarians, who pursue full income equalization. The contrast with the evidence reported above is likely due in part to differences in the experimental design and in part to the sample nationality. The experiment was in fact conducted in Norway, where egalitarian norms are, arguably, part of the national social ethos (see section 3.5). In a still unpublished work, Almås et al., (2016) replicate the same experiment in Norway and the US, finding a proportion of strict egalitarians in Norway more than twice as high as in the US. By contrast, libertarians are more than twice as numerous in the US as in Norway. Farina and Grimalda (2012) find comparable results.
Differences in the way people assess inequality in their societies also emerge in survey studies. Osberg and Smeeding (2006) find in general gross underestimation of the extent of income inequality in each of the country being surveyed, where perceived inequality is measured by the ratio of the estimated earnings of firm CEOs to production workers. Such underestimation is largest in the US. Most importantly, opinions differ widely across countries on the extent to which people at the top end of the income scale are entitled to earn in relation to people at the bottom. The acceptable ratio of top earnings to bottom earnings can vary from a mean value of 12.3 in Japan to one of 3.1 for Spain.
Given that many people in each country show a general tendency to hold people responsible for their choices, but not for the effects of luck, an interesting empirical question is where exactly individuals place the “responsibility cut” (see section 2.4). The evidence on this aspect is scant, but seems to favor the view that some attributes for which people should not, in principle, be held responsible, such as their natural talents in performing certain tasks are seen as valid entitlements to acquiring larger earnings (Konow, 2003). In other words, people generally seem to favor a meritocratic view whereby individuals are entitled to reap the benefits from all the attributes of their person, but not those of random events external to their person.
Few studies assess how people react to relative need. In one of these studies, Cappelen et al. (2013) find that individual needs are important factors in people’s propensity to redistribute. In particular, willingness to transfer resources by individuals living in rich countries toward individuals living in poor countries is higher than the share of income given as foreign aid. Nonetheless, factors other than needs, such as individual merit, appear to be even more relevant in explaining preferences for redistribution. Overall, their evidence suggests that perceptions of international justice might differ from perceptions of national justice. Cross-country empirical evidence is still in its infancy; therefore we need more research to check the robustness of the findings here reported.
3.7 Science and Technology Study and feminist perspectives
3.7.1 Science and Technology Study perspective on Social Justice and Well-being
A Science and Technology Studies (STS) perspective shifts focus from a normative discussion of how justice and equality ought to be conceived to the concrete practices by which they have been achieved. Attention is directed to how multiple interpretations of (in)justice and (in)equality are enacted and become embedded in more or less durable institutional structures, technologies of governance and social norms. The STS perspective attends to the diversity of existing pathways towards social progress, advocating plural, and potentially contested, understandings of ‘progress’ that are situated in context. The focus of research is on the interaction of semiotics (concepts) and materiality (things) and the diversity of actors/actants (both human and non-human) that co-construct social progress.
Social justice, from the STS perspective, can be conceptualized in terms of the processes by which ethical concerns for equity become embedded in co-evolving “configurations that work” (Rip and Kemp 1998:387) in specific contexts. These configurations, or sociotechnical assemblages, are comprised of practices, collective norms, shared expectations, theories, laws, accounting techniques, machinery, built environments, rules of ownership and access, IP, market mechanisms, financial instruments, commons management and taxation regimes. Barriers to social justice, such as inherited sociotechnical landscapes of embedded inequality, can also be analyzed from the STS perspective, thus deflecting a more essentialist focus on the anti-social pathologies associated with self-interested rational behavior, represented by some as ‘human nature’.
In a world where great inequality persists and many millions of people live in dire poverty it is tempting to focus on all the barriers to the achievement of social justice and well-being. But this will not necessarily contribute to a forward looking endeavor where we are being asked to project onto the future what social science has learnt about how society learns, adapts and transforms. The STS perspective employed here asks what can be learnt by examining the diversity of path dependent processes involved in practically enacting and achieving social justice. Section 5.4 examines national economic and social policy that has influenced path dependent processes aimed at achieving social justice in a range of states and world regions. It also examines some important mechanisms of state and community governance that have been employed in specific national and regional contexts to monitor or achieve social justice and increased well-being.
3.7.2 Feminist perspectives
A feminist perspective on paradigms of justice emerging from Western European thought distinguishes between theories that emphasize justice as freedom, justice as equality, and justice as solidarity (Ferguson, 2009). Those seeking forms of social justice, including gender justice, have participated in projects informed by all of these theories, but only some have radically transformed specific causes of injustice.
Justice as freedom is conceived within this framework as a neoliberal or libertarian form of justice in which individual and political liberties—including the right to private property—are prioritized over any collective or government control that might jeopardize these liberties. This perspective ignores the situation of certain ‘classes’ of people who through historical forms of expropriation from land and ongoing discrimination cannot freely exercise civil and political liberties, including the right to private property and the freedom to own the new wealth that their labor produces. The practice of ensuring the ideal of ‘equal freedoms’ for individuals can, thus, obscure the on-going production of social injustice for whole groups.
Justice as equality is, as the previous sections have demonstrated, the predominant formulation that has influenced policy making directed at promoting equality in its various guises. It encapsulates a social democratic vision of redistributive justice in which the government, acting for the social whole, ensures individuals the positive freedom “to have the opportunity to meet their basic material needs and the tools they need (health, employment, education, and housing) to freely choose to pursue their life goals” (Ferguson, 2009: 165). At the global level this form of justice informs development projects by which wealthier nations act on their obligations to poorer nations they have historically harmed (Pogge, 2002). The mechanism by which material equality is ensured is via redistributive payments from the social wealth/surplus harnessed by the state. However, the capacity to equalize opportunity for all by state-led distributions of social surplus is limited by the untouchable nature of privatized wealth protected by the very freedoms espoused by libertarian theories of justice.
Both these ideals of justice and their accompanying practices and policies challenge neither the capitalist economic growth paradigm, nor the operations of the state as an enabling agent of capitalist development. Indeed they work nicely to affirm the key individualizing ideologies that normalize capitalist practice and obfuscate the collective theft of wealth and its concentration in few hands, that is, the manufacture of social injustice. The extent to which these theories of justice create actually existing social justice and well-being for all classes and categories of people is thus limited, but there are nevertheless situations in which, guided by these theories, processes for creating social justice and well-being for many have worked in historically contingent and path dependent contexts (as other sections of the Chapter demonstrate).
The final form, justice as solidarity, is informed by a relationality that places the ethical principle of care for the other at the center of justice concerns. The origins of this perspective are rooted in both the socialist tenet “from each according to his/her ability, to each according to his/her needs” and the feminist politics of recognition of the rights of those oppressed by exploitation, alienation, marginalization, cultural imperialism and violence and the need for transformational solidarity (Ferguson, 2009; Young, 1990, 2000; Hooks, 1984). Justice as solidarity foregrounds practices which transform the social and economic conditions of life for those who have experienced these multiple forms of oppression through the creation of “alternative systems that subvert the logic of capitalism, racism and sexism” (Ferguson, 2009: 171). Importantly these practices enable people to develop their human capabilities and to engage in democratic participation in social decisions. The redistributive actions involved are not limited to reallocations of social wealth appropriated by the state, but include non-state led interventions that share access and right to the production of wealth and access to basic needs.
One entry point into the complexity of path dependency is to look to the ways in which theories of justice with their diverse emphases have interacted with political decision making and technologies of governing to inform social processes that have created well-being and social justice in place. In Section 5.4 some key social justice “configurations that work” in situ are analyzed from an STS and feminist perspective.
3.8 Subjective well-being and its paradoxes
In spite of the concerns exposed above on the possibility of founding a sound notion of social justice on subjective well-being (see section 2.1), the interest in measuring subjective well-being and in comparing it both within countries – for instance comparing cross-sections of people or individuals across their life cycles - and between countries has grown conspicuously in the last decades. Partly, this interest is due to the popularization of the so-called the Easterlin paradox (1974) in economics and of the theory of hedonic adaptation in psychology (Kahneman et al., 1999).
The Easterlin paradox brings out a puzzling contradiction: while satisfaction co-varies with one’s income level in each period, there is no increase in average life satisfaction over long periods of time in spite of a tripling of income levels over the period. This puzzle is based on responses to large-scale survey questions conducted in the US and elsewhere, inquiring about individuals’ satisfaction with their lives. Figures 10a and 10b illustrate the paradox in the case of the US and Japan.
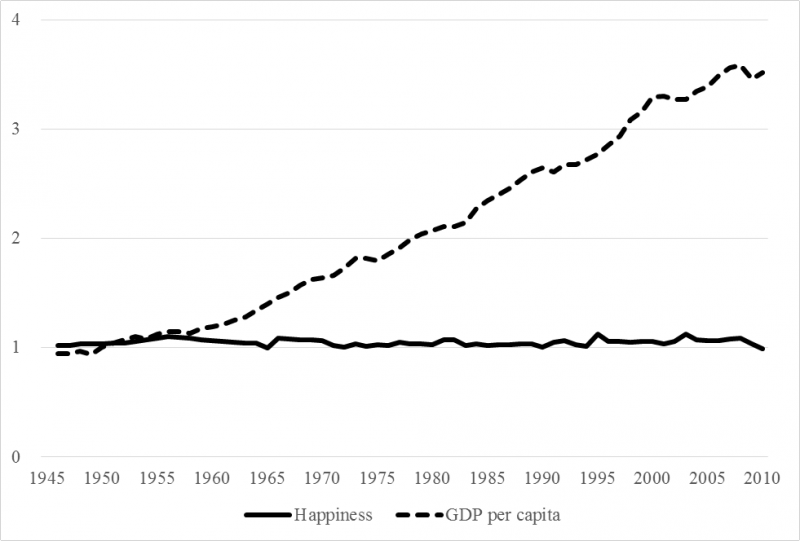
Figure 10a: Income and happiness in the United States
Source: Ono and Lee 2016, forthcoming

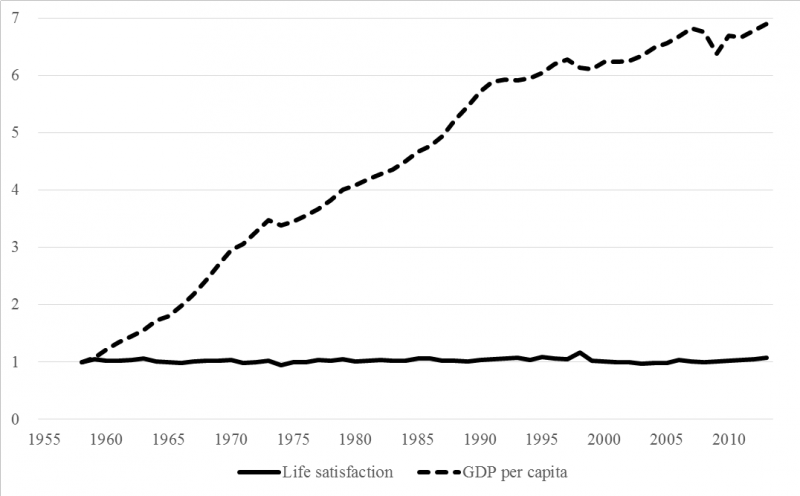
Figure 10b: Income and life satisfaction in Japan
Source: Ono and Lee 2016, forthcoming
The Easterlin paradox points to a disconnect between objective well-being, as proxied by income, and subjective well-being, as measured by survey questions. The paradox has been confirmed in country-level cross-sections as well. Figure 11 shows the relationship between Gross National Product per capita and aggregate happiness from 65 countries based on the World Values Survey (Inglehart and Klingemann 2000). We observe a slightly positive association, as indicated by the moderately positive slope. More specifically, we see that the slope (which shows the improvement in happiness as a change in national income) is greater among low-income countries, and flatter among high-income countries.
In fact, if we only look at the high-income countries, clustered at the top right-end of the distribution, then the variation in happiness is small indeed. If we draw a horizontal line that cuts across countries, for example from the Philippines to Austria, we can see that happiness is indistinguishable between a low-income country such as the Philippines compared to a high-income country such as Austria. The horizontal line thus suggests that national income does not explain variations in happiness very well.
Alternatively, we can draw a vertical line around the GNP per capita $5,000, which indicates that there is huge variation in happiness within a national income level. In other words, Belarus and Brazil are nearly identical in terms of national income, but worlds apart in terms of happiness. We thus arrive at the same conclusion, that objective well-being is not a sound predictor of subjective well-being.
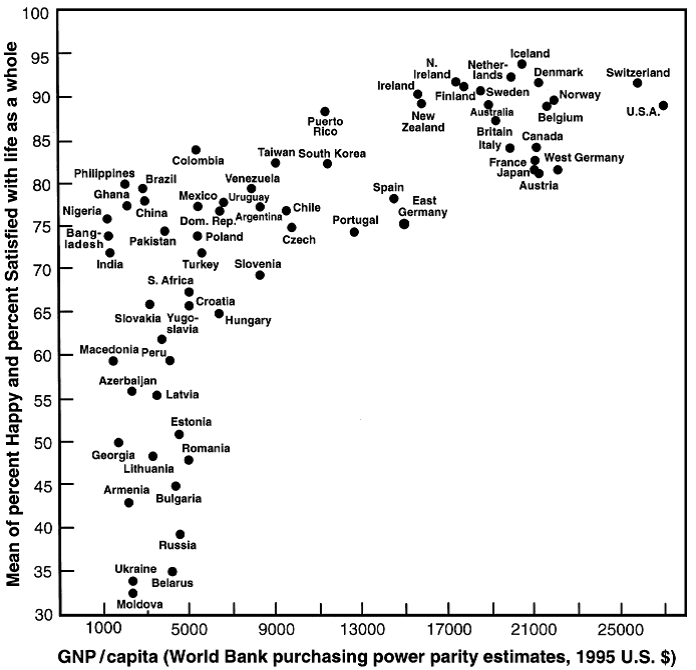
Figure 11: Aggregate happiness by Gross National Product (GNP) per capita
Based on the World Values Survey data.
Source: Inglehart and Klingemann 2000
One solution to the Easterlin paradox lies in the idea that a substantial portion of individual consumption is “positional” (Layard and Layard, 2011). That is, individuals derive utility not just from consuming a given good (or service) but also by consuming it while others cannot. The owner of a luxurious sport car will be normally much happier if she is the only owner of such a car in her neighborhood than when everyone owns an equally valuable sport car in her neighborhood. The reason of such a “positionality” of goods is given by the fact that people enjoy consumption, at least in part, because of the social status that is associated with such goods. Social status is by construction a scarce resource, which is eroded as more people get access to the goods conferring social status. Social status is at its highest when only one individual owns the good. Consumption by additional individuals erode the social status of individuals who already owned the good. At the limit, when everyone owns the good, no social status can be gained. Clearly not all goods have the characteristic of being positional. However, for those goods that are indeed positional, a rather perverse mechanism is set in place. That is, consumption by an additional individual creates a negative externality, that is, a loss in the utility from consuming the good, among previous consumers.
It is precisely such a negative externality that may be the root cause of the Easterlin paradox. In a cross-section of individuals, people with higher income will typically have access to a larger share of positional goods, so their subjective well-being will be higher than poorer individuals who have access to fewer or no positional good. At the same time, levels of subjective well-being over time will not necessarily grow, precisely because of the negative externality associated with positionality. Even if we consume more, our satisfaction in fact decreases as others also consume more. Many societies, and Western ones in particular, have indeed managed to achieve high levels of generalized consumption. This explains why the levels of subjective well-being cannot have grown linearly with consumption. The fact that levels of subjective well-being have in fact grown so little over time is, according to this account, testament to the idea that a very large portion of our consumption is indeed positional. The Easterlin paradox, therefore, highlights that with increasing our consumption “we run to stand still”. Consuming less than others brings about dissatisfaction, but consuming more than others will only bring about a transient increase in satisfaction.
Layard and Layard (2011) propose to treat consumption as any goods that produce a negative externality on others, like smoking, i.e. taxing it a fairly high rate. The observation of the little gains in subjective well-being derived from additional consumption also poses some difficult questions to policy-makers convinced that the main target of economic policy should be economic growth. The evidence from Figure 11 clearly shows that economic growth can be enormously beneficial in the poorest countries, but very little beneficial in the richest ones, to increase individual subjective well-being. This is of course only one component of the set of individual characteristics that policy-makers should care about when making policy decisions. However, on the basis of this and complementary evidence, it may be argued that the focus of policy-makers should switch from material development to what we may call “personal” development, as a country switches from the “low-income” region to the “high-income” region. Personal development includes aspects that have been proven to be relevant for people living in rich societies, such as social relationships with others, autonomy and freedom of expression (Inglehart and Wetzel, 2005). We believe that the studies triggered by the Easterlin Paradox have uncovered a potentially ground-breaking way of conceiving economic and social policy.
It is important to note however that there is some controversy over the Easterlin Paradox. Betsey Stevenson and Justin Wolfers (2008) used large scale data – primarily but not only from the Gallup World Poll – and show a stronger linear relationship between per capita income and average levels of national happiness. In a subsequent paper they also show a stronger relationship between economic growth and happiness than Easterlin does. While they claim to de-bunk the paradox, much of the discrepancy is in the questions that are used to measure well-being in the first instance, and in the time frame and sample of countries that are used in the second.
The question that is used to measure life satisfaction in the Gallup World Poll is the Cantril ladder question, which asks respondents to think of the best possible life they can imagine and then to place themselves on an 11 step ladder where zero is the worst possible life and 10 is the best. While most of the correlates of more open-ended life satisfaction questions and the ladder question are very similar, the coefficient on income is stronger at both the individual and country level.
This is not surprising as the ladder question introduces a relative frame. Graham, Chattopadhyay, and Picon (2010) find that the ladder question correlates much more closely with income within and across countries than does life satisfaction in general and much less so than do hedonic measures of well-being, such as smiling yesterday. Kahneman and Deaton (2010) find similar patterns for the U.S. And even Stevenson and Wolfers find much less significance in the correlations between life satisfaction and general happiness questions and income in their cross-country and over time work.
In exploring the relationship between life satisfaction and growth, Easterlin, meanwhile, uses a longer time frame and different sample of countries than do Stevenson and Wolfers. The Gallup World Poll data only runs from 2005-2013, while Easterlin’s data goes back several decades. He finds no significant relationship between economic growth and life satisfaction over a longer time frame.
3.8.1 Beyond the Easterlin paradox
The state of the art in subjective well-being metrics has advanced significantly in the past decade. While economists in particular were initially very skeptical of data based on expressed versus revealed preferences, there has been a widespread increase in the use of survey data in economic and other analysis. It has, in turn, yielded consistent patterns in the determinants of subjective well-being responses of hundreds of thousands of respondents across countries and over time. Research across disciplines finds that the responses to these questions correlate with psychological, genetic, and other bio-markers of well-being.
There is now broad consensus that the measures are robust and can be tracked across countries and over time (see, for example, Helliwell, Layard, and Sachs, 2013), and that the patterns in the determinants of subjective well-being across individuals and countries are remarkably consistent. Income matters within countries, and respondents with means typically score higher than those without sufficient income, but other variables, such as health, employment status, stable partnerships, and political freedom are typically as important (Graham, 2009).
As such, scholars are able to control for the stable patterns and explore the well-being effects of a range of things that vary, such as macro-arrangements and inflation or unemployment rates on the one hand, and individual behaviors such as smoking or exercising on the other. The metrics are particularly useful for exploring questions which revealed preferences do not answer very well, such as the well-being effects of macro and institutional arrangements that individuals cannot change and/or behaviors that are not driven by revealed preferences but by strongly imposed norms or addiction and self-control problems.
Some of the most recent research has explored a reverse channel of causality – in other words, what does well-being cause? Early economics research based on panel data found that individuals with higher levels of life satisfaction performed better in later years in the labor market and health arenas (Graham, Eggers, and Sukhtankar, 2004). This confirmed similar findings by psychologists based on smaller samples but more detailed data (Diener et al., 2005), in which individuals with higher levels of cheerfulness did better in later life.
The research has developed in more recent years. DeNeve and Oswald (2012) used a large U.S. representative panel to show that young adults who report higher life satisfaction or positive affect grew up to earn significantly higher levels of income later in life. They used twins and siblings as comparison controls and accounted for factors such as intelligence and health, as well as the human capacity to imagine later socioeconomic outcomes and anticipate the resulting feelings in current well-being. Ifcher and Zarghamee (2011), based on experimental data, isolate the effects of mild positive affect in reducing time preferences over money and in the ability to delay gratification. Oswald and Proto (2012), also based on experimental data, showed that positive affect induced by video-clips resulted in subjects putting forth a greater quantity of output (10-12%) although no difference in quality. They also found that bad moods induced by bereavement or illness in the subjects’ families had a negative effect on productivity.
DeNeve and co-authors (2013) conducted a general review of the existing research on well-being and positive outcomes. They found that there were benefits in the health arena, such as improved cardiovascular health, immune and endocrine systems, lowered risk of heart disease, stroke, infection, healthier behaviors, recovery speed, survival and longevity. In the income and social arenas the studies found increased productivity; peer-rated and financial performance; reduced absenteeism; creativity and cognitive flexibility; cooperation and collaboration; higher income; organizational performance; reduced consumption and increased savings; employment; and reduced risk taking; pro-social behavior (altruism, volunteering); sociability, social relationships, and networks; and, critical to the focus of this chapter, longer-term time preferences and delayed gratification.
As the “science” of well-being measurement has developed, the metrics are increasingly being used to complement objective metrics of progress based on income, health and education status, and similar indicators. And the increasing use of the metrics by government statistical offices in many countries around the world has resulted in a set of best practices for data collection which attempt to avoid biases such as in question framing, day of the week effects, and scaling issues.
Scholars in the field increasingly agree on two distinct dimensions of well-being: hedonic/ experienced and evaluative. The former assesses respondent’s moods and affect as they go through their daily experiences. Are they, for example, smiling or worried, happy or anxious when they are at work, commuting, with family and friends, or in other activities. Daily recall questions in large N surveys, such as “did you smile frequently yesterday?”, correlate quite closely with more detailed measures, such as those which ask respondents to de-construct the previous day’s activities and assess their moods at each particular juncture. That allows for much larger scale usage of these metrics than was originally possible. Evaluative metrics, meanwhile, which have been used in large-scale surveys for much longer, assess respondents’ satisfaction with their lives as a whole - across various domains of well-being and over the life course. The most common questions used are: “generally speaking, how satisfied are you with your life as a whole”, and the Cantril ladder question, which asks respondents to place themselves on an 11 step ladder, where 0 is the worst possible life they can imagine and 10 is the best possible life they can imagine.
Hedonic metrics are better suited for assessing quality of lives and associated interventions designed to improve people’s short-term experiences. Evaluative metrics are better for assessing respondents’ capabilities and opportunities (in the spirit of Amartya Sen, see section 2.3). Evaluative metrics correlate more closely with income than do hedonic metrics, not because income is equivalent to happiness or well-being, but because those respondents with more income have more ability to control their lives and to choose the kinds of lives that they want to lead. Evaluative metrics implicitly include the eudemonic or Aristotelian dimension of well-being, which is the ability to lead a meaningful or purposeful life. Some surveys, such as the well-being module in the British Office of National Statistics annual survey, explicitly include a eudemonic question. The ONS survey asks respondents to assess how much purpose or meaning they have in their lives, on the same 0-10 scale as the life satisfaction question there-in. Answers to this question typically correlate closely but not perfectly with life satisfaction responses.
Subjective well-being metrics provide a new lens into the question of social justice and well-being and indeed in well-being. Graham (2011) and Graham and Nikolova (2015), for example, find that respondents who are limited in their means and capabilities can report to be very happy, simply because they have adapted to adverse circumstances (Sen’s “happy slaves” critique). Yet when asked more framed evaluative questions, such as the Cantril ladder question, these same respondents will score significantly lower. Along the same lines, very poor respondents with poor norms of health often report to be satisfied with their health, while those with better norms of health and higher expectations have lower scores. Respondents in Kenya are as satisfied with their health as those in the U.S., and respondents in Guatemala are more satisfied with their health than those in Chile, even though objective indicators in both the U.S. and Chile are significantly better than those in Kenya and Guatemala.
While the subjective scores alone cannot serve as a basis for welfare assessments or policy choices, the gaps between the objective and subjective indicators provide important and often novel insights which can, for example, help explain persistent poverty and injustice traps, including very unequal distributions of well-being within and across societies. Large differences in expectations for the future, meanwhile, which are closely linked to subjective well-being, can result in beliefs and behaviors channels which contribute to even greater inequality.
For example, recent research in the U.S. finds significant inequalities in well-being across socioeconomic cohorts. A significant percent of the poor are living in the moment, with high levels of stress and other markers of ill-being, and lacking the capacity to plan for or invest in their futures. Wealthy cohorts in the same country, meanwhile, have very high levels of well-being and almost unlimited capacity to invest in their own and their children’s futures. The gaps in hope and expectations across these two cohorts, makes success seem even less attainable for the poor, adding an additional disincentive to making the necessary investments in education, health, and savings (Putnam, 2014; Graham, 2016, forthcoming). Such trends are surely not unique to the U.S. (although they are remarkable for such a wealthy country), and characterize the differences in the lives – and life chances – of the rich and the poor in many developing countries around the world.
Research from the post-communist (or transition) economies shed light on the complexities underlying the linkages between political systems and well-being. As illustrated in Figure 11, the transition economies are clustered in the lower left corner and consistently rank among the unhappiest countries in the world. While one may assume that the transition from communism to market capitalism may lead to an improvement in the quality of life and well-being overall, in fact the transition had the opposite effect. Almost without exception, people in the transition economies – from Eastern Europe to China – report significantly lower life satisfaction after the transition (Ono and Lee 2016, forthcoming).
Unhappiness in the post-communist countries come from many sources. First is the deterioration of the social safety net. Under communism, people were fully “insured” under a comprehensive safety net, and guaranteed employment, education, and healthcare. Unsurprisingly, the decline in satisfaction following the transition is most acute in the life domains where support was assured prior to the transition (Easterlin 2010). For example, in the case of the former German Democratic Republic, the largest drop in satisfaction were in the domains of childcare, work, and health. In contrast, gains in satisfaction were reported in material consumption, such as goods availability and dwelling. It is further worth noting that the deterioration of the safety net coincided with the timing of improved economic conditions and rising aspirations. Relative deprivation and increased anxiety have undoubtedly lowered people’s subjective well-being and perceived quality of life.
Second, there is a deep sense of social injustice and powerlessness among the citizens. People had high expectations that the transition was the path to meritocracy where there would be ample opportunities for advancement based on effort and achievement. The transition and its accompanying market reforms fell short of people’s expectations, and optimism was replaced by hopelessness.
Hopes of well-functioning markets were displaced by persistent inequality, widespread corruption and organized crime following the transition. The post-Soviet economies consistently rank among the most corrupt countries in the European Union according to Transparency International. The transition countries also rank low in the “trust index.” Overall, the transition has left these countries with a deep sense of injustice and unfairness. People feel powerless as they perceive that nothing can be done to overcome these market failures.
And third, many people of the post-communist countries experienced depreciation or devaluation of the skills that they had acquired prior to the transition (Guriev and Zhuravskaya 2009). Unfortunately, many who were educated under a command economy acquired skills that became irrelevant, hence valueless, for the market economy. Consequently, many people lost their jobs and were forced to reallocate and to adapt to the new labor market dynamics.
3.9 Domains of social justice and well-being
All societies allocate resources, risks and opportunities between men and women, rich and poor, educated and non-educated, children, adults and old people in a differential way. Markets, families, communities and states are the major spheres through which this happens.
3.9.1 Markets
Markets distribution of wealth, security and opportunities is based on an essentially de-centralized rationale. Individuals decide where and how they use their assets, resources and capabilities. In doing so, they are establishing general parameters of supply, demand and prices. These parameters will determine future possibilities of making use of the existing opportunity structure given their assets at time two. The principles governing these systems are those of competition through market exchange, and prices carry with them the information that for the most part autonomous self-interested agents will look upon and use to make decisions about the quantities to offer or demand in markets given certain production functions and budget constraints.
Individuals who engage in market dynamics do not only or always make choices based on utility maximizing criteria based on their self-interest. Altruism and a wide array of situations might lead agents to behave otherwise as experiments in behavioral economics and real situation analyses suggest, but to a large extent the dynamics that take place in markets and the exchanges that happen there are assumed to be carried out by men and women pursuing their self-interest.
Markets are linked to well-being and social justice in two critical ways. In the first place because markets are one of the central mechanisms by which activities are coordinated, resources are allocated for production and distributed for consumption they affect both the efficiency with which this happens and the shares that people get of total output. Secondly markets are supposed, in an ideal version, to provide returns to merit and talent through innovation and competition.
3.9.2 Families
Individuals also decide their actions in terms of resource pooling, claims on resources, consumption, time and effort allocations in the production of goods, services and care within the family and household. In the case of families this actions cannot be not thought of as only driven by autonomous self-interested agents. That is not to say that such actions are devoid of any self-interested utility maximizing behavior: but there are three important caveats that should warn us against any simplistic translation of market principles and logics into family action and systems.
First actions are bounded by internal authority figures and by shared norms that have nothing to do with fair markets or leveled playing fields. No matter how much we want to argue that such is also the case of markets, the degree to which actions within families depend upon direct norms that contradict explicitly the notion of an autonomous agent. Equating market with family logics is a mistake both theoretically and empirically.
Second, there is no such mechanism as prices to carry information in an unequivocal fashion to each member. Praise, support, the provision or retrenchment of affection and affectionate actions, claims on resources, psychological and physical punishment are many, -not always desirable- ways in which family members provide and receive information regarding their actions and the utility effect of such actions.
Third, the actions of individuals in families are dictated by prescriptive norms that affect behavior due to coercion, internalization of what is right. While in the long run contextual changes that modify the returns and adaptive capacity of families do transform family norms and behaviors, these are much more “sticky” than norms in markets.
3.9.3 Community
The broader community is another sphere affecting the allocation of resources, opportunity and risk. Members of a community affect such distribution.
1) They sustain systems of allocation of resources that are neither based on market dynamics nor on family: charity groups, religious organizations, trade unions, NGOs are all channels through which resources flow and are distributed, providing income, food, insurance, protection, shelter, etc.
2) They affect a wide array of actions that are undertaken in families and markets through collective action and social enforcement. Religion is a critical community arena where a lot of what is deemed right or wrong becomes settled and is enforced through varied societal and cultural mechanisms.
3) They receive recognition and valuation that are nor dependent upon market position nor family position. Communities are places where groups of people or larger organizations produce a sense of self and belonging.
3.9.4 States
To many the state differs from the other spheres in that is an essentially centralized sphere that responds to the “natural” distribution of opportunity and risks that markets, families and communities produce. Yet to speak of centralized response to natural risks is a simplification. Opportunity and social risk are necessarily products of decentralized agents in the market, families and communities and state action.
There is nothing intrinsically “natural” in the way markets, families and communities produce and distribute quantities and qualities of risk. The existing dynamics result from parameters institutionally defined by the state and by cultural and religious beliefs rooted in long term incentives and canonic and legal norms. Thus state decisions are not characterized or differentiated from markets, families and communities by its “artificiality” but by being binding and authoritative (Przeworski 2003).
Markets and communities generate aggregated parameters which will become constraints for actions and opportunities later. But they do not make decisions related to the collection and redistribution of resources and the regulation of behavior which are legally binding. This is the role of the state alone.
The state collects resources and redistributes. It regulates acceptable and non-acceptable behavior. It intervenes with incentives in the working of market, families and community (Przeworski 2003). In other words, the state determines the opportunities and risks as it controls the tax systems, the public expenditures and the laws which regulate interactions among people and groups.
The functions of the state have a definite impact on the way in which markets, communities and families either contribute or limit well-being and social justice. Through the extraction of taxes the state limits the degree to which individuals are entitled to keep resources to themselves and enclose and pool their assets and resources within families and pass them along generations. Indeed a part of the income and wealth generated and accumulated through labor or production and selling that takes place in markets and that is originally received by individuals cannot be consumed or saved by these individuals or pooled within the family because it is taken away by the state.
Secondly: The state also provides individuals and families with income transfers, services and public and merit goods that are critical for the support of the well-being of individuals and families. Family allowances, pensions, education, health care, mobility and urban infrastructure, to name just a few, are resources granted to individuals by and through state policies. In some cases these resources are granted by the mere fact of residence or citizenship, in other they are dependent on labor market incorporation, in other they are granted because of familial ties and responsibilities
The regulatory capacity of the state is central to think about markets, families and communities. Policies and legal norms enacted by the state can reinforce any of the micro or macro level functions of markets, families and communities depicted above.
States contribute with differential actions to the opportunity and risk production structure. The unprotected old people of the low solidarity models will be protected in the social states where there exists universal coverage of rent and social services for the elderly. The children will depend less on their families’ fortunes and misfortunes in countries with preschool and full time school are universal. Divorced women who depend economically on their ex-husbands will be more protected if there is state regulation of the economic transfers between ex-partners and if there are support systems for the female headed households.
As families, communities and markets change, the distribution, type and quantity of both opportunity and social risks and the devices for social protection change as well. Since states are part of that production structure they should contribute to shape and answer through regulation, taxation and redistribution. When this does not happen, families, communities and markets undertake adaptive processes and absorb such risks and provide some of the opportunities.
To play that role certain conditions must be fulfilled: Families must have available resources and time in addition to stability and cooperation among members. Communities must have norms of reciprocity and trust anchored in minimal. Markets must perceive potential profit associated with a given opportunity of risk absorption.
The social health of individuals, families and communities is under stress not only by increasing inequality in the distribution of income and wealth, but also by a host of other related features:
- Intra-generational traps: individuals do not have access to mobility channels through the life course.
- Catastrophic events: sudden processes of descending social mobility
- Breakdown of solidarity and cohesion: individualistic solutions tend to dominate adaptation strategies.
- Zero sum solutions: conflicts increase both between and within generations and genders at the family, community and national level.
Markets alone cannot and do not solve these problems, nor can families or communities. States and the international global system of states can do much to steer markets and families in the right direction
4. What have we learned from the contests between economic systems?
4.1 Competition
The textbook concept of ideal competition can mislead the discussion of markets, governance, and social justice. The concept of real competition is inspired by Joseph Schumpeter, who, in his book Capitalism, Socialism and Democracy (1942), coined the phrase Creative Destruction to emphasize how the new competes with the old and eventually replaces the old. This is the type of contests that is relevant for the feasibility of a more just society.
Schumpeter’s basic idea - that stems from Karl Marx - is that the newly created product, method of production, market and industrial organization, revolutionize ‘’the economic structure from within, incessantly destroying the old one, incessantly creating a new one. This process of Creative Destruction is the essential fact about capitalism. It is what capitalism consists in and what every capitalist concern has got to live in’’ (Schumpeter, 1942: 82).
Real competition is dynamic, but it is not only a race to create new products, new technologies, or new work organization where the winner obtains a temporary monopoly position that constitutes the private benefits of innovation. The distinction between real and ideal competition extends way beyond dynamic technological choices. The real competition takes place also in non-market areas including institutional change, organizational design, in politics and between economic systems. In contrast to the personal incentives, individual solutions and short sightedness of ideal competition, real competition often rewards complementary gains such as cooperation, trust, and long term thinking. This is why global competitive forces can induce social equality that revolutionizes the political and economic structure from within.
Of course, the essence of all competition - real and ideal - is contest and rivalry. But here the similarity stops. Real competition is about innovation broadly defined. The contest is to be first to do something new where some contestants win and others lose, creating economic inequalities between them. Thus there may be great differences between winners and losers, and often the winners take all. Real competition may therefore require countervailing power to produce good results, and social organizations such as unions can be important to create the complementarity between capitalist dynamics and social security. A concern for social dynamics must be based on a perception of real competition, not its ideal text book variants, concentrating on the small margins. Real competition is also over discrete choices, great leaps and social and economic systems.
4.2 Socialism versus Capitalism?
Eric Hobsbawm characterizes the period from 1914 to 1991, from the first world war to the fall of Communism in eastern Europe and the Soviet Union, as the short twentieth century[4]. The fifty years prior to that was a period in which the ideology of socialism spread rapidly in Europe, inspired by the writings of Karl Marx and Friedrich Engels (The Communist Manifesto (1848) Das Kapital, vol. 1 (1867)). Marx proposed a theory of historical materialism, which asserted that a mode of production would last as long as it stimulated technology (what he called the productive forces) to improve.
Each mode of production (slavery, feudalism, capitalism) had, Marx claimed, its progressive period, in which it fostered technological development (with concomitant increases in labor productivity). Eventually, however, the property relations that characterize a mode of production (e.g., the slave bond, the tying of the feudal serf to the lord’s manor, the worker under capitalism who voluntarily trades his labor for a wage to a capitalist who owns the means of production) become a fetter on the further development of the technology, and those property relations are replaced by other ones (‘burst asunder’), that will continue to foster technological development.
The mechanism through which this creative destruction of property relations occurs is class struggle. Thus, feudalism eventually was transformed into capitalism, as a result, so Marx claimed, of serf revolts and the competition from a new merchant class in the towns, and a growing class of independent workers, not bound to feudal manors. In the process bonded serfs became free laborers. Marx and Engels, in their 1848 manifesto, argued that the capitalist mode of production was reaching the end of its progressive period, and that it would be toppled and replaced with a system of property relations – socialism – which would foster the further development of technology, labor productivity, and human flourishing.
In this revolutionary transformation, capitalist workers, who own no capital, become workers who jointly own the capital stock of the country. The private and highly concentrated ownership of capital characteristic of capitalism would come to fetter technological development, and would be replaced by some kind of social or public ownership of capital.
We do not need to evaluate the logic of Marx’s theory here: interested readers are referred to G.A. Cohen’s Karl Marx’s Theory of History: A Defence (1978), the most rigorous treatment available of the theory. What’s salient is that the theory ignited a fuse in Europe – which eventually spread around the world – to organize socialist / communist parties to bring about the socialist revolution. In 1871, the workers of Paris occupied the city, establishing themselves as the Paris Commune, and attempted to organize Paris on a socialist basis. The Commune lasted a few months, until a massive military assault upon it by the French army succeeded in overthrowing it.
The first socialist revolution that succeeded in a whole country was the Bolshevik revolution of October 1917 in Russia. The Soviet Union lasted until 1991, when it peacefully imploded and was replaced by a capitalist regime. Most of the formerly state-owned resources and firms, within a decade, ended up as the private property of a small group of new capitalist oligarchs, in a property grab organized by Boris Yeltsin, that puts the nineteenth century American robber barons to shame.
It is fair to say that this ‘short twentieth century’ was a contest between capitalism and socialism, and by most accounts, capitalism won. Of course, China remains a huge country that has found a formula for escaping the economic sclerosis that characterized the eastern European and Soviet economies. China’s leadership continues to call its mode of production socialist. But certainly, with the possible exception of China, capitalism appears to be the only option on offer. Although economic inequality is extreme in the advanced capitalist countries in the west, and in the developing capitalist economies in the rest of the world, the present period is markedly different from 1850: no Karl Marx has emerged with an inspiring and radical vision of transforming capitalism into a system more effective at meeting human needs.
One of our tasks in this chapter is to ask whether, indeed, capitalism is the ‘end of history.’ Must we tolerate the extreme concentration of wealth and income – even after taxes – that characterize advanced capitalism? Do, that is to say, the relatively high living standards of most people in these countries, depend upon a system of economic organization that rewards those at the very top so lavishly?
Those lavish rewards would perhaps be tolerable if those who receive them were in other ways ordinary citizens. But they are not. With wealth comes power and political influence. Families with this kind of wealth will spend considerable resources to prevent democratic movements from confiscating their wealth through taxation. They will attempt to influence the state to protect their privileges.
One can ask whether a de jure democracy can possibly be a de facto democracy if the wealthiest one-thousandth of the population own almost one quarter of the total wealth of the country. Globally, the wealthiest 1% of households owns 50% of the wealth.
An important qualification to this perhaps pessimistic evaluation should be made. While capitalism continues to distribute income and wealth in highly unequal way, there are major differences between advanced capitalism today and its predecessors a century ago. Taxes comprise, on average 35% of gross national product in the OECD countries, and in the Nordic countries, that fraction is either slightly above or slightly below 50%[5]. These tax revenues are spent on universally distributed private goods (such as education, health care and child care) and on public goods. That is to say, the welfare state has grown immensely in the twentieth century in the OECD countries, and this has massively improved the lives of citizens. Nevertheless, despite the security that the welfare state provides, the concentration of wealth is extreme in these same countries. In the United States, the wealthiest 1% of households owned 32% of total wealth in 2010. In France, they owned 25%, and even in egalitarian Sweden, they owned 20% of the wealth.
Even more dramatic is the concentration of wealth within the top 1%. In 2013, the wealthiest 0.1% of US households owned 22% of the wealth: that is, the average wealth of the 150,000 households in this slice of the population was 220 times as much as that of the average US household. In 1929, just prior to the stock market crash, the wealthiest 0.1% owned 25% of the wealth. So the advance of the welfare state does not appear to have done much to dent the portfolios of those at the very top of the wealth distribution[6].
Perhaps the welfare state and social equality more generally can help triggering the real competition in a more just direction? How do more social equality and more worker security affect economic development interpreted as a process of creative destruction? Does a more fair distribution of earnings come with a cost? Does social equality slow down or speed up the process? Shortly we provide answers to such questions. As we shall see, equality can be particularly good for economic development.
4.3 Soviet Union --- political dictatorship without markets
To explore what the possibilities are with respect to economic organization in the future, we must evaluate why the Communist experiments of the twentieth century failed (with the possible exception of China, which we will discuss later). To recapitulate, the Marxist vision was that the extreme concentration of wealth and income that characterized mid-nineteenth century capitalism, and its concomitant impoverished proletariat, would be replaced by an economic regime in which the capital stock of the country was owned by everyone.
This formulation is, however, vague: should capital be distributed equally to all households, and held in private ownership, should it be allocated to groups of workers who would organize their own firms, or should it be held by the state, which organizes production with state-owned firms, whose profits go into the state treasury? In the event, the formulation that won out with the Bolshevik revolution was the third one. The state would own the capital stock, organized into state-owned firms. In the Soviet Union, this included agricultural land, upon which the economic units were collective farms and state-owned agribusiness.
We believe that there were two principal mistakes that, eventually, destroyed the Soviet-type economies. The first was a system of political dictatorship, which lacked even the imperfect mechanism of political accountability that characterizes capitalist democracies. In January of 1918, Lenin abolished the Duma, the Soviet parliament, which was the forum in which political parties could compete over policy[7]. From then on, the Soviet Union was a dictatorship, with the Communist Party in control.
The second error, that was not clearly visible for a while, was the refusal to introduce markets to organize production and distribution[8]. The fear that markets would bring with them a reappearance of capitalism was sufficiently strong among the leadership of the Soviet Union that markets and freely moving prices were never introduced, despite an active discussion of the question in the 1960s (see Evsey Liberman (1962)), and despite some economic reforms that did occur in the 1960s[9].
The reason that the system of resource allocation through central fiat was not initially seen as an error was that, for many years, the Soviet economy performed quite well. In particular, industrialization was sufficiently rapid in the 1930s for the USSR to build up a defense industry that was able, along with the Soviet military machine, to turn back Hitler’s onslaught on the eastern front. The Soviet Union was the only country that succeeded in repelling Hitler’s invasion, and it was eventually largely responsible for the defeat of Germany. (Twenty million Russians lost their lives in the war; the US lost half a million.) Industrialization was successful because it depended mainly upon moving millions of semi-productive farmers into factories and the cities, a process that did not require markets. Indeed, in the early 1950s, many in the west thought that the Soviet economy would soon outperform western economies[10].
Moving semi-employed farmers into factories, however, is the low-hanging fruit of economic development. The more subtle problem of organizing complex inter-firm trade, providing goods to consumers when and where they are needed and desired, and innovating, cannot be organized by centralized allocation – at least, this is the case in a large, complex, modern economy. True, the Soviet economy was able to develop one or two sectors (such as space travel) by focusing a great deal of talent on the problem (much as the United States did in its centrally planned Manhattan project that produced the first atomic bomb), but there is no example of a centrally planned system solving the millions of problems that must be solved to innovate and allocate resources in a complex economy. When the Soviet economy reached the stage that it had to do so in order to advance, it hit a wall – sometime in the 1960s or 1970s.
Markets perform the function of allocating many kinds of goods and resources, even when there are millions of people who need the goods and hundreds of thousands of firms that use resources to produce them, in a relatively efficient manner. They do this by providing individuals and firms with material incentives – typically, the firms and entrepreneurs desire to maximize profits, workers desire to earn a decent living, and consumers (who are also workers) desire to meet their household needs within their budgets. There are a number of caveats concerning the efficiency of markets, but these should not obscure the fact that markets are an essential institution, one that has evolved over millennia, that we do not know how to replace. Any complex economy must use markets, at least in the foreseeable future.
The problem is that market systems, unless properly managed, lead to huge inequalities of income and wealth. Those who succeed in the competition to provide commodities to a public that desires improvements and novelty in its daily life can become fabulously wealthy (Bill Gates’s wealth is approximately $80 billion, more than the gross domestic product of 124 countries.) The key question we must address is whether it’s possible to have a high standard of living, fairly equally enjoyed in the population, with a large complex economy, where economic activity is organized using markets. The leaders of the Soviet-style societies of the short twentieth century elected not to introduce markets because they believed the answer was no. The only way of maintaining a semblance of equality was, they believed, to stick to the system of central allocation. In the end, this engendered economic sclerosis and implosion of the system.
4.4 China – market competition without political competition
The Chinese Communist leadership, learning from Soviet errors, decided they must transition to a market economy: this was the deduction of Deng Xiao-ping. They saw Japan, South Korea, Taiwan, Hong Kong and Singapore leaping ahead of them. In 1979, under Deng’s leadership, the Chinese began dissolving the collective farms and leasing land to peasant households on a long-term basis. At the same time, they gradually introduced markets for agricultural produce. This is not the place to recapitulate recent Chinese economic history, but the summary is that, with the gradual spread of markets throughout the economy, gross national product grew by perhaps 9% a year for a period of thirty years, implying that the average material standard of living grew by a factor of thirteen in a single generation. Hundreds of millions of Chinese people came out of extreme poverty, perhaps the most dramatic episode of poverty eradication in history. Indeed, the increase in income of Chinese households lowered significantly global inequality, as measured by the Gini coefficient of household income globally, as the Chinese peasantry comprised a large mass of the poorest in the world.
However, China did not succeed in simultaneously preserving what any reasonable observer would call a socialist society. In 2015 there were 3.6 million millionaires in China. (Presumably, this figure refers to annual incomes in dollars; those with wealth in the millions would comprise a higher figure.) Inequality within China is quite severe: the Gini coefficient of household income is higher than that of the United States (see Figure 3, this chapter)[11]. While the public sector of state-owned firms continues to exist, the private sector is growing rapidly. The new Chinese bourgeoisie displays no semblance of a socialist mentality: indeed, they build palaces to live in, consume ostentatiously, and attempt to copy the behavior of the most decadent aristocratic Europeans of the nineteenth century[12].
So far China’s leaders have been unwilling to use tax policy, redistribution, and social empowerment to lead the development towards a more socially just society --- perhaps because they believe that such measures are bad for economic growth and development.
4.5 The Nordics --- markets with social democracy and social ethos
Several European countries and the Nordic countries of Denmark, Finland, Iceland, Norway, and Sweden in particular pioneered a model based on political democracy, capitalist property relations (meaning: predominantly private ownership of firms), a market economy, a comprehensive organization of workers in labor unions, and high taxation financing a pervasive welfare state. The political parties that organized this experiment called themselves social-democratic, as opposed to the Communist parties of the Soviet-style countries and China. Rather than dictatorship by a single party, there has been democratic political competition between freely formed parties in these countries. More significantly, there has been a very limited use of public ownership: almost all firms are privately owned by families or shareholders.
Yet, the Nordic countries have achieved what is probably the highest degree of income equality in the world (see section 1.2), and the greatest security for ordinary people through a large welfare state. As we said, government economic activity is financed by about one-half the gross domestic product of the country, which is collected through various forms of taxation.
The Nordic system rests on a specific social ethos, which has made possible for these countries to remain egalitarian. The Nordic social ethos is well summarized by a statement of Per Albin Hansson, a leader of the Swedish social-democratic party in the late 1920s. He said (in a speech in 1928):
The basis of the home is community and togetherness. The good home does not recognize any privileged or neglected members, nor any favorite or stepchildren. In the good home there is equality, consideration, cooperation, and helpfulness. Applied to the great people’s and citizens’ home this would mean the breaking down of all the social and economic barriers that now separate citizens into the privileged and the neglected, into the rulers and the dependents, into the rich and the poor, the propertied and the impoverished, the plunderers and the plundered (italics added). Swedish society is not yet the people’s home. There is a formal equality, equality of political rights, but from a social perspective, the class society remains and from an economic perspective the dictatorship of the few prevails.
The italicized statement defines the kind of solidarity that the social-democratic parties attempted to teach the citizenry, with a great deal of success. The social ethos is one of cooperation and reciprocation: I will make my contribution to society, in full expectation that others will do the same. The concepts of trust and social capital do not cover the same phenomenon. (For instance, there were a lot of trust and social capital among the Hutus in Rwanda just before the genocide in 1994, but there were definitely very little social ethos.)
In any case, social ethos is a far cry from the capitalist ethos, which is individualistic, and values only the individual’s advancement – in particular, the increase in his or her material wealth. One’s country should be one’s home, according to Per Albin Hansson, with all the connotations of mutual aid and respect that characterize a good home.
Now the success of Nordic social democracy, many say, is due to several of the special features of these countries: they are small and at the time their welfare states and social ethos developed, they were homogeneous – linguistically, ethnically and religiously. Some of this is clearly true, but the social and economic cleavages and the inherent conflicts in the Nordic countries at that time are also part of the story.[13] To appreciate the achievements we also have to recall that the economies that the social democrats inherited in the 1930s were far from affluent. There was open unemployment in the cities and disguised unemployment in the countryside. In Norway around half of the population lived in sparsely populated areas where most made a living from farming and fishing. The real per capita GDP of Sweden and Norway was below the current real per capita GDP of the low middle-income countries today. Thus it is clear that a majority of citizens in the Nordic countries became rich under the social democratic model of governance, not before.
The social democratic mode released an impressive development path of modernization and structural change. Over a period of more than 80 years economic growth has been at least on a par with that in the US, but with much more social involvement and egalitarian distribution of the proceeds (Barth, Moene and Willumsen 2015). As the system evolved, the earnings distribution became more and more compressed. The low wage inequality and the increasing mean level have also induced more egalitarian policies of health, education, and social insurance against income loss and old age.
Throughout the social equality has been sustained by external pressure on internal behavior. Global economic competition on the outside has led to local cooperation on the inside where the division line is the border of the nation state. In larger countries a similar distinction between external and internal could be placed at a lower level than the entire nation. The resulting egalitarian practices and policies have had clear effects on the private sector as well. We will return to this. Policies that make workers more healthy and capable also raise profits from modern technology --- and capitalists naturally respond by investing more in it. When this is the case, the productivity of sectors and enterprises becomes less dispersed, reinforcing the initial impact of the egalitarian policy. Some equality creates more.
As a result the Nordic countries not only have the smallest wage differentials and the most generous welfare states, but the most modern economies and the highest employment rates in the world as well. Like most countries the Nordics have also experienced raising wage inequality recently – but the magnitudes are smaller and the level of wage inequality in the Nordic countries is still record low.
4.6 Latin America --- marked based divorce between state and democracy
Social reformers in Latin America look at Northern Europe now and then, but more often than not just to do the opposite of what the small open economies in Europe have done. (A comparative perspective on Latin America and the Nordics is contained in an appendix in the end of the chapter). In comparison to its European counterparts, Latin America gives us the clearest case of how capitalism can be extremely unequal, hugely inefficient, and largely authoritarian - at the same time.
Historically, the oligarchic period of the late 19th century and early 20th century indeed showed the bad sides of capitalism without democracy in pure form. The entry of this periphery – as many Latin American scholars call their countries -- into the world economy was marked by slave trade and the expanding production of sugar, cacao, tobacco, salt and later cattle. It shaped an anti-liberal variant of capitalism with coerced labor and extreme levels of inequality --- with long term consequences.
But the system was not always stagnant. In the early 20th century economic growth and the share of exports in GDP were higher than in Europe. The income per capita was similar in Argentina and the UK, in Uruguay and France, in Chile and Norway, in Brazil and Italy and in Mexico and Portugal, Finland or Greece (Clark, 1940, quoted in Halperín, 1997). Hence, the development was associated with exports of primary commodities and imports of manufactured goods - both sides divorced from state involvement.
When the first world war hampered the flow of imports, however, Latin American firms moved albeit shyly to produce replacements. Import substitution was therefore a reality long before it became a home-grown theory of economic development associated with the work of Raul Prebisch.[14] He led the Economic Commission for Latin America (CEPAL) from its start in 1948 with an ambition to establish a new school of development economics based on the protection of infant industries helped by an active state that should provide subsidies, tariff protection, and planning (Montecinos and Markoff’s 2001). Most countries adopted Import Substitution Industrialization (ISI) that fitted quite well with their emerging populist governance.
Even though Peronism in Argentina, Varguism in Brazil, APRA in Perú, the PRI in Mexico were all seen as progressive movements in the beginning, they led in fact a development characterized by a crisis of social incorporation.
Import substitution was based on inefficient market dynamics. The gaps between insiders and outsiders, formal and informal workers, became wider and wider. Economic growth stagnated, inflation soared and fiscal deficits became increasingly unmanageable. By the 1960s the easy phase of import substitution was over. Deregulation of finance, commerce, and labor markets followed. The new neoliberal regime abolished the small welfare state and replaced it by market options for those who could pay.
The result was a catastrophe both economically and socially.[15]The entire transformation took place within a broader epochal change: the end of conservative modernization as it was defined by Barrington Moore. The triumphs of electoral democracy, urbanization, educational attainment and increased exposure to new and broader consumption patterns had destroyed the political basis of conservative modernization. While the arenas that can turn expectations into legitimate demands had expanded radically, access to the means to satisfy such demands had remained unequal and segmented until the end of the century.
The so called shift to the left in the region is the political outcome of this second crisis of incorporation. The Washington Consensus was indeed the last attempt of incorporation under conservative modernization dynamics: pushing for democracy, education and incorporation into market dynamics, but leaving unchanged and at some points even deepening the inequality of opportunity, status and asset enclosure.
Comparing the Latin American development to that of Northern Europe we should notice that in Latin America inequality and a concentrated landholding pattern allow for a rentier style of living and an elite who saw no need for innovations. The ISI model allowed for formal low productivity firms to survive through generous subsidies and protection from international competition. If wages rose too much, more subsidies and protection was granted. Subsidies replaced productivity enhancing innovations. Rentiers and labor aristocrats constituted in effect an anti-Creative-Destruction alliance.
Income differentials grew together with the informal sector. As the welfare state only served workers in formal urban jobs, and never those in rural areas and in informal jobs, the system produced a large mass of uneducated and poverty stricken citizens. Neither did conservative modernization foster an industrial working class and a middle class that were loyal to democratic ideals. While social insurance in Northern Europe was an act of solidarity, it was in Latin America an act of the supporting the privileged. Import substitution industrialization closed markets from external competition and allowed for the survival of low productivity traditional sectors. The unions that emerged worked to maintain their acquired wage premiums.
In sum, import substitution in Latin America allowed large landowners to retain their low wages and productivity and placed wage setting in the hands of a small unions with relatively high wages in line with the subsidies and protection their sectors received. The export lead development in the small open economies in Northern Europe allowed the largest and most militant unions in the export sector to dominate the quest for wage moderation for all workers (in line with what the export industry could tolerate ) and for a universal welfare state that could insure all against fluctuations in the world economy.
5. Mechanisms to Enhance Social Justice and Well-being
The first mechanism we analyze concerns how fairness in the earnings distribution can enhance productivity and growth. To illustrate we first discuss the effects of compressing the distribution of labor earnings. In reality, a policy of reducing wage differentials was central not only in the Nordic countries, but to some extent also in countries like South Korea and Japan under the name of wage compression. We are then interested in the link from wage compression to a development that might benefit the great majority in the long run, building on Moene and Wallerstein (1997), Barth, Moene and Willumsen (2015), and Moene (2015).
This experience is worth studying in the abstract simply because it demonstrates how the principles of social equality have been used to remain competitive in the global economy. Thus social equality cannot be a drag on development and efficiency. When global competition can direct the main institutions and policies in a more collaborative and egalitarian direction in small open economies that are so directly exposed to competition in the world market, it must be economically feasible to use a similar strategy in larger economies where more of the activities are only exposed to domestic competition.
5.1 Development as a process of creative destruction
Developed and developing countries may both use the most modern technology in some applications. The basic difference is not tied to the most modern equipment. The difference is in how widely the most modern equipment is used, which again depends on how profitable it is in use, given the size of the market, the qualifications available in the labor force and the wages that must be paid.
For instance, both India and Sweden have a modern Information Communication Technology (ICT) sector. Yet, having a modern ICT sector, and even if it were more modern than that in Sweden (which it is not) would not make India more developed than Sweden even in the application of the information technology. The overall application of information technology in Sweden is much higher than in India. In fact, Sweden ranks three on the ICT Development Index published by the United Nations International Telecommunication Union. Denmark is number one, Norway number six, while India does not appear on the list at all. It is this difference in wide application of the most modern technology that leads to the development gap. In other words, the economic development of a country cannot be defined by its most modern applications or innovations. The level of economic development is determined by the average application of each innovation once it becomes a new and available design.
We are interested in the use of innovations and in how already known technologies, designs and organizational principles are implemented – and in which scale. Some important innovations are more or less directly embodied in new capital investments, or at least require investments. Even though such innovations are lasting, they do not last forever. A business, for instance, that once revolutionized production and dominated the market for a new product, experiences falling profits as rivals introduce new and improved designs. As the process continues the scale of new improvements becomes so large, and profits decline so much, that the original technology becomes obsolete. So a successful innovation is normally a source of temporary market power, eroding the profits and position of firms using older technologies, yet in the end it too must give way with the entrance of new competing technology.
One way to make the idea of creative destruction analytically tractable is to incorporate it into a growth model with capital equipment of different vintages (Moene and Wallerstein, 1997). In that set-up newer capital equipment (of recent vintage) is more productive than older ones. To invest in the new technology is costly, so older vintages are not immediately replaced by new innovations. The modern technologies gradually replace the old and obsolete ones. The key decisions are therefore when to invest in new equipment and plants and when to scrap the old ones.
Capitalist innovation and adaptation means that new production units are established as long as new investments yield positive profits. On the other end of the productivity distribution we find how the creation of more productive equipment makes old technologies (vintages) obsolete. They cannot cover variable costs and are scrapped. At any one moment in time, however, there are both older and completely new technologies in use, distributed over production units and enterprises.
For short we use the term ‘thickness’ of modernization to capture how widely modern technologies are applied once they become available. It is seldom profitable to replace all existing capital equipment once newer and more modern technologies and designs become available. Creating new jobs, or building new plants, is costly, so older equipment is not immediately replaced by new innovations.
5.1.1 Inequality generates inefficient productivity differences
Consider now two economies, one modern with a high level of previous innovations, and one more backward with a much lower level of previous innovations. For the sake of the argument, let both economies employ their entire workforces. The first economy would have a narrow gap between the most modern and the least modern technology in use with a corresponding distribution of workers over high productivity technology within a narrow productivity range. The second, less developed economy, would have a much higher gap between the most efficient and least efficient technology in use.
The reason is that its thin layers of each technology imply that the workforce is distributed over a wide range of technologies from the most modern to the very backward technology. The gaps between the least and the most modern technology in use are also reflected in the distribution of labor earnings. When the return on investing in the most modern technology is more or less the same across countries, the considerable difference in the development gaps across countries must imply that there are significant differences in the distribution of wages within each country as well.
If then a technology with very low productivity, relative to the most productive technology, is profitable to use, it must mean that wages at the bottom must be correspondingly low relative to the wages in the most productive units - for instance wages to a rickshaw driver relative to an ICT worker. In the first, developed economy, in contrast, the gap between the highest and lowest wages would be much lower as workers are employed under much more similar conditions.
Do we find the differences in development gaps in reality? One way to illustrate the gaps is to compare the distribution of ‘total factor productivity’ in different countries. To provide the numbers requires a substantial effort and some courageous assumptions. (Hsieh and Klenow 2009 and Barth, Moene and Willumsen 2015 apply methods that err on the safe side by focusing on total factor productivity and not only labor productivity). The numbers are meant to reflect 'the level of economic modernization' in our discussion. Comparable numbers for exactly the same years in all countries are not available.
Many observers have thought of the US economy as the most efficient and most modern economy in the world. It is therefore a natural benchmark and starting point. Comparing the US to India, we find that the productivity gap in India is much higher than in the US, irrespective of how we measure it. We can think about this as an illustration of the effects of development. A jump from the first to the ninth decile in the productivity distribution implies a 330 per cent increase in the US (in 1997), while in India (in 1994) a similar move would imply a 2140 per cent increase. In other words the first decile in India has 4.7 per cent of the productivity of the ninth decile, compared to 30 percent in the US. Other measures confirm the pattern: development implies a smaller gap between the most and the least productive technology in use and the change can be large.
Comparing the US to China confirms the pattern. Developing China has a higher gap between the least and the most productive technology in use --- but the gap is less than in India, reflecting the fact that China is more 'developed' than India.
Comparing the US to Norway, illustrates another important feature. A jump from the first to the ninth deciles of the productivity distribution in Norway (in 1998) implies an increase of 123 per cent, while in the US (in 1997) a similar move would imply a 330 per cent increase in productivity. The first decile in the productivity distribution in Norway has 80 per cent of the productivity of the ninth decile, compared to 30 per cent in the US.
Contrary to what many observers believe, Norway (and the Nordics generally) has a much lower productivity gap than the US. According to our measure the US is far from being the most efficient and modern economy in the world. Egalitarian countries have smaller development gaps and thus more modern economies, implying that a larger share of the workforce is employed in high productivity jobs. We view this as a stark illustration of how wage equality affects structural change under the process of creative destruction --- the full implications of which are discussed next.
The development gaps reflect the levels of wage inequality between workers who work in enterprises and occupations with different productivity. The development gaps are highest in developing countries. There the labor force is distributed over thin layers (vintages) of capital equipment with relatively few jobs in each layer of productivity. Once it has been invested in, it is not easy to change the productivity of the capital equipment. A rickshaw can never become a modern truck even after it is well known how a modern truck works and is designed. When wages are tied to the productivity level in each local production unit --- an empirical fact in decentralized labor markets --- an economy with thin layers of each technology has large wage inequality.
There is a corresponding forward looking feature: When wages are tied to the productivity level determined by the investment in technology in the local production unit, new investments in the most modern technology become lower than they otherwise would have been as their profitability is not high enough. The local wage costs in new investments are simply too high. The resulting low rates of investments in new technology imply that each layer remains thin. Each technology is also bound to last for long as it is less threatened by rival entry of new technologies. Thin layers of long lasting innovations are again decisive for the high level of wage inequality.
The inequality is caused by the dispersion of productivity across enterprises as long as wages are tied to the technology invested in each local enterprise. This wage determination also explains why the high dispersion in productivity is sustained by profit-maximizing investment decisions. Thus high wage inequality is associated with a stagnant backward economy which sustains the inequality.
More generally we can think of the wage as consisting of two parts: a prevailing base wage that goes to every worker of similar quality, and a local wage premium tied to the productivity of the local plant or sector. The level of wage inequality for a given dispersion of productivity becomes higher the more the local wage premium is tied to local productivity.
5.1.2 Social Equality as development strategy
Like social democracy, social equality as a development strategy is based on evolution, not intelligent design. It is not a set of ready-made political and economic formulas. It is participatory democracy enriched by the influence of comprehensive social organizations, based on a search for political and economic development paths that can be implemented democratically by majority support.
The political feasibility of the arrangement is in fact the first cousin to what Daron Acemoglu and James Robinson, in Why Nations Fail, describe as inclusive institutions: ‘while economic institutions are critical for determining whether a country is poor or prosperous, it is politics and political institutions that determine what economic institutions a country has…. Inclusive economic institutions…are those that allow and encourage participation by the great mass of people in economic activities that make best use of their talents and skills and that enable individuals to make the choices they wish’ (2012). In his positive review of their book Jared Diamond (2012) emphasizes that this is exactly what Nordic countries have done: ‘the ultimate development of inclusive political institutions to date is in modern Scandinavian democracies with universal suffrage and relatively egalitarian societies’.
The many skeptics who from the start have doubted the long-run economic and political feasibility of social equality have by now been proven wrong several times. Some critics claimed that social ethos had no chance as social victories would be continually eroded by market forces. Others claimed that market forces would steadily be eroded by social reform and deteriorate economic performance. Neither was right.
On the contrary, the Nordic experience demonstrates that equality combined with social ethos is not an alternative to market orientation, but rather complements in the sense that social democracy as society model enables all major interests to benefit from social reforms implemented in market economies in the following sense: Markets function better as a representative democracy when the incomes are shared fairly, and social reforms work better when they are constrained by market competition. Social democracy as a mode of organization and a society model combines the aspirations of the majority of the working population and the private interests of the capitalists. It creates social incentives for the allocation of capital without challenging capitalist ownership per se; it creates social incentives for good work performance and export orientation without challenging union control. In this sense it entails functional worker security, functional market orientation --- and functional development.
In Section 3.4 we discussed how the Nordic system combines equality with innovation and growth for economies at the forefront of industrialization. Can a similar model be applied to developing capitalist economies – especially the large ones, of Brazil, Indonesia, India and Russia? Contrary to what many believe, we insist that social equality in one form or another is as economically feasible for developing countries today as it was for the Nordic countries in the 1950s. We do not suggest, of course, that it is desirable or politically feasible to imitate the special forms that Nordic equality took. This point is actually more general. No successful country-experience offers ready recipes for how other countries can escape poverty, underdevelopment, and corruption. Accordingly, nobody can engineer social ethos, trust and prosperity by just importing institutions from other countries. To learn is not the same as to imitate.
Everywhere development is full of economic and political obstacles that may be specific to the country. Most developing countries nevertheless have certain typical problems in common in addition to being underdeveloped. They have what is called a surplus of labor and a large informal sector. Given that, we wonder whether it is possible to raise the lowest incomes or wages without increasing the level of unemployment. This is a basic question for everybody who hopes that social equality can be used as a development strategy. Although low productivity jobs can never pay the market wages of high productivity jobs, our basic claim in this section is that greater social equality nevertheless can simultaneously raise the lowest pay and the level of modernization and average incomes without creating unemployment.
5.1.3 The size of the home market
Above we have considered two links between wage inequality and development. Economic development affects the wage distribution and the wage distribution affects economic development via job creation and job destruction. Together the two links can explain why economic development is unequal across countries and regions. Wage compression stimulates economic development and the demand for workers in more modern enterprises, raising the lowest wages and eliminating gradually the jobs with the lowest productivity without creating unemployment.
This is supply side story on incentives to invest in modern technology and skills as wages are compressed. What about the demand side? The process of modernization is like a production process with increasing returns to scale. The larger the scale, the wider the modernization can be, and the higher the productivity per worker can become. But the degree of modernization is limited by the extent of the market. And the extent of the market again depends on the level of economic development and modernization. Markets do expand through the higher incomes that further development and modernization generate. This mutual dependence can be crucial for economic development and economic growth, in particular in local economies without an easy access to larger markets. The participants in the local economy can be locked into a development trap where the extent of the market is too small to generate further modernization and where modernization is too low to generate a large enough market.
Globalization may imply a lot of things, including an easier access to foreign markets. This access may have two positive effects within our set-up. First of all, the level of modernization is no longer limited by the size of the local markets, making further modernization and development more profitable. Better market access may lead to a takeoff. If development takes off, it is profitable to invest more in each new technology. Thus, the second effect is that each new layer of modernization may become more comprehensive, which in itself leads to further wage compression. The lowest wages are eliminated since these jobs are no more profitable. The average wage goes up since modernization and development increase the share of modern jobs.
The extent of the market can of course also be affected by public policies. Local demand is important. Yet social equality as a development strategy does not necessarily depend on public intervention on the demand side just to regulate total demand. The long run extent of the market --- both private and public demand --- is determined by the extent of modernization and specialization. In all cases it is decisive what the public demand actually realizes. Public policies of health, education and social insurance are inherent requirements in social equality as a development strategy, not because these policies generate public demand, but because they bring about necessary provisions that the market does not supply with equal efficiency.
5.1.4 Only one way?
An important element of social equality as development strategy is wage compression, or wage restraint, that reduces the local wage premium. It can be done in various ways. The Nordic way is to take wage setting out of market competition and place it in a system of collective decision making. The South-Korean way is to subsidies skill formation or education in ways that create a higher number of workers with the relevant qualifications and thus lower market bargaining power, which in the next round can drive down the local wage premiums.
As indicated, a wage setting that constrains the local wage premium resembles the Scandinavian system of wage coordination quite well. The coordination imposes a peace clause at the local level that limits the use of strikes and lock-outs after the central negotiations are completed. Of course, Scandinavian authorities also heavily subsidize education and training programs with similar effects on local wage restraint.
To see the effect of wage compression let us again return to our comparison of the two hypothetical cases --- one path that has evolved with high local wage premiums (the US and Indian cases) and the other path that has evolved with low wage premiums (the Nordic and South-Korean cases; see section 3.4.2). Wage restraints imply lower expected wage costs and thus higher expected profits over the lifetime of an investment. As a consequence investments in new technologies in the Scandinavian and South-Korean cases are higher than in those of the US and India. The layer of technology is therefore thicker in each vintage of the equipment since more investments have been made with the new technology. So even if the two paths have exactly the same level of employment the lowest wage must be on a higher level in the case of wage compression.
5.1.5 Only fixed investments -- in small countries?
Is the above comparison fair? Large countries like India and Brazil have many idle hands, and the lowest wage would not rise with wage restraint higher up in the wage distribution because of this labor surplus. This might be so in the short run. But the situation at the bottom of the wage distribution would be even worse in the long run if there is no wage restraint at all higher up in the wage distribution. Without wage restraint investment is even lower and those who stand outside the sector of modern production will remain there for a much longer time.
Does the mechanism of social equality only apply in sectors with fixed investments? We think the effects of wage compression in these sectors are more evident than in, for instance, service provision. Yet, the investments may also come as local training programs in service provisions. The less the local wages are tied to local improvements, the more training each enterprise may find profitable to undertake. Again wage compression may give us the highest rates of modern training where the workers benefit more widely and more collectively as broader segments of the workforce might be offered training.
A skeptical reader might also fear that executive salaries are excluded from wage compression. Of course they should be included. In the Nordic countries executive pay is not officially a part of the union wage contracts. Yet executive pay is affected by the power of unions and the involvement of employer associations in the central wage negotiations --- and by the social ethos in the work force. Everybody involved knows that if the executive pay is aggressively raised, the unions become less willing to continue with wage moderation – and more aggressive to the disadvantage to capital owners. As a consequence employers tend to keep executive pay more in check in the Nordic countries than in the more ‘backward' capitalist economies like the US and UK. It is the countries with low union influence and little social ethos that have the highest gaps between the remuneration of top executives and average employees. This kind of inequality is also contagious. To cap top salaries is clearly an important element in any strategy of social equality as a development path.
In all cases, it might be puzzling that the average wage in the work force goes up with wage restraint, at the same time as the expected wage cost of each new investment declines. The puzzle is easily resolved. Lowering the expected wage costs speeds up the process of creative destruction -- both with fixed capital investments and with investments in skill formation--- moving a larger share of the work force to more productive jobs. So even if wages in the most productive units were to decline, more workers would move from lower productivity to higher, raising their average wage. In other words, even though the local bargaining power of work groups declines, members of the groups are moved to more productive circumstances where even a lower bargaining power yields a higher wage.
5.1.6 Moving from low productivity to high productivity jobs
The reallocation of workers contributes to wage compression, eliminating the jobs with the lowest wages and moving workers to jobs that are better paid. The responses of capitalists to more wage compression is to invest more in new technology that leads to an even smaller gap between high and low wages. Clearly, the highest paid workers receive a smaller rise as they work in the best production units, and cannot gain from the reallocation of workers in other ways than through a higher base wage. Their total wage may thus decline as their local wage supplement might go down more than the prevailing wage increases.
The logic of self-enforcing wage equality is simple. For a given dispersion of productivity, wage inequality is higher the more wages are tied to local productivity. Untying wages from local productivity reduces wage inequality. This change stimulates job creation and job destruction that reduce the dispersion of productivity, leading to further reduction in wage inequality.
In this context it may be worth noting that historically the smaller wage differentials in Sweden and Norway were defended more in terms of efficiency than in terms of equity. In the 1950s, two Swedish trade union economists, Gösta Rehn and Rudolf Meidner (Rehn, 1952), argued that equalizing wages across Swedish firms and industries would promote economic development by forcing wages up in low-productivity firms or industries and keeping wages down in high-productivity firms or industries. By reducing profits in low-productivity firms and increasing profits in high-productivity firms, labor and capital would be induced (or coerced) to move from low productive to high productive activities, increasing aggregate efficiency as well as improving equality (Moene and Wallerstein 1997, Agell and Lommerud, 1993).
5.2 Welfare spending as development
A second mechanism for enhancing social justice is based on welfare spending. We are interested in the following question: What do welfare states do? And, in particular, what can welfare states do in developing countries?
5.2.1 Capability enhancement
Welfare spending is social reproduction. It heals, trains, and takes care of workers– and thus reproduces their labor power. It repairs damages. It raises workers’ capabilities and their functioning. It reduces workers’ vulnerability to both exogenous shocks and to power abuse by others. When we get more of it, workers become more valuable, more secure, and more productive.
One way to visualize this is to consider the mutual links individual productivity and functioning on the one hand, and the individual income on the other. The total productivity (for short) of the individual consists of the physical productivity of the means of production in the actual activity together with the individual ability to work hard and to utilize the opportunities. Together the two determine the individual incomes. Let us call the link from individual productivity to income by the I-curve.
The other, often neglected, link goes from income to productivity. Let us call it the P-curve. Formally what we denote the P-curve is often studied as how nutrition affect workers ability to exercise effort (Dasgupta and Ray 1987), but it is easy to include several extensions. Clearly, the income of the producer determines not only the nutritional level, but also the credit to acquire necessary inputs, and the vulnerability without a proper social insurance (Moene, 1992).
To see the development impact we are interested in the equilibrium where the productivity generates an income just high enough to sustain the productivity. In many developing countries this equilibrium is a low-productivity trap where insufficient income generates insufficient productivity. It can consist in corrosive disadvantage, as we have claimed it in section 2. The resulting low productivity obviously produces low income and a low income can maintain the low productivity. The producer (worker or peasant) may be unable to acquire important inputs that are complementary to work. This further constrains the ability to use the actual opportunities effectively. Equally important is the vulnerability to shocks that can lead individual households into a persistent low income and a low productivity coupled with hopeless indebtedness and other forms of dependence on others who can exploit them. Temporary shocks can thus have lasting bad consequences.
5.2.2 What does the welfare state do?
The welfare state can change the self-enforcing equilibrium.
First of all, it can lift the P-curve by enhancing a worker’s capability for every level of income. It provides social insurance and health services -- and thus increases workers' strengths, help in preventing poverty traps of bad health and severe destitution. It provides education which again affects the productivity in each activity and each enterprise where the better educated workers participate.
Second of all, it can also lift the I-curve by altering the link from productivity to income. It can induce more risk taking that can be decisive to obtain gains from specialization and investments in skills and equipment. It can empower producers who then can stand up against land owners, employers and other strongmen. The public provisions make workers less vulnerable to abuse of power (Barth and Moene, 2015).
India offers many examples. A fine overview of all the social programs in India can be found in the compilation of articles and overviews by Dreze and Khera (2015), providing a critical discussion of the impressive results.
5.2.3 Help the millions that go hungry even in good years
India has the world's largest (but least known) school feeding program that lifts up the P-curve by providing one meal to all students every day. Thus the child get better nourished and the rest of household also gets more to eat, having less mouths to feed in the mid of the day raising nutritional standards and school enrolment (in places by more than 20 percent), and reducing child labor.
India also has the world’s most comprehensive rural employment program that lifts the I-curve yielding higher incomes for each productivity level. The program guarantees 100 days of paid work to every adult rural person. Many of the participants in the program are women who not only obtain better material conditions, but also more power in their villages.
The former International Development Secretary in the UK, Hilary Benn, clearly saw some of the benefits from programs like these -- not only in India but more generally in Africa, Asia and Latin America. In a presentation in 2006, he emphasized how the welfare state ''can stop a farmer selling precious assets - her livestock, farm tools - when she suffers a crisis, such as a drought or someone in her family becoming ill. It can help her and those many millions who go hungry even in the good years, when there is no drought. Social security can encourage her to take risks with higher yielding crops. It can encourage poor families to keep their children in school - as shown by very successful schemes in Brazil, Mexico and South Africa. All of them contribute to growth, but also to a fairer and more equitable society''. Combined, such changes may have strong effects.
5.2.4 A social multiplier at the household level
Consider first the case where the I-curve remains unchanged, but where the link from income to productivity, the P-curve, shifts up. The higher productivity for each income level generates a higher income that in the next round generates an even higher productivity and an even higher income -- in a self-enforcing process. Thus there is a social multiplier at the household level that magnifies the initial improvement into positive adjustments in work efforts, incomes and productivity.
Similarly, if the P-curve remains unchanged and the I-curve shifts up, a cumulative process of changes are set forth adding up to a social multiplier at the household level. No matter which of the two curves that gets the initial boost, we have clear magnified effects when one of the curves changes and the other remains unchanged, we clearly have even stronger effects when both curves are lifted up simultaneously.
In other words, a welfare state arrangement can be a highly beneficial investment that not only improves the well-being all else being the same, but also expands the set of feasible opportunities and enhances the ability for each to take advantage of them. It can help produce fertile functioning, as we called it in section 2. The public welfare provisions can spread the costs of necessary insurance. It can provide social protection against shocks, misuse of power, and the probability of becoming trapped in deprivation. It can help people to avoid the slippery slope of poverty as the welfare arrangement can stop temporary bad events from leading to chronic poverty.
The same basic two links between income and productivity, the I-curve and the P-curve, may also give rise to two locally stable equilibria. They may sustain an outcome where a high productivity produces a high income that can maintain the high productivity. Whether or not there are two equilibria like this for each individual depend on the form of the two-ways links between income and productivity. In any case the welfare state can affect the situation in a way that magnifies productivity increases.
The effects become most dramatic when there are two locally stable equilibria, and the introduction of welfare state provisions shift the equilibrium from the poverty trap with low income and low productivity to the elevated stool with high income and high productivity. But even when there is a unique equilibrium, welfare spending can have a significantly magnified effect. As we have shown, it first raises income of vulnerable groups. Next, the higher incomes that each member of the group receives generate an additional income growth. The higher access to resources raises their productivity further which again leads to a higher income, and so on. Naturally, the process converges to a new and higher level of productivity and income than before. Welfare spending can have similar effects in employment relationships with inefficiently low wages.
5.2.5 Empowering workers with inefficiently low wages
Can any employer benefit from setting a low wage and obtain a low effort when he knows that a high wage would yield a high effort? The answer is yes, he can benefit from higher profits. A low wage strategy is profitable as long as the decline in wage costs, when wages are reduced, is greater than the decline in the total revenue when efforts go down with lower wages (Moene 200x, 2016).
Thus the employer needs to be powerful and must to some extent be able to force the workers into compliance with his terms. In low productivity jobs, manned by vulnerable and low-skilled workers with few outside options, this may often be the case. Such bad jobs are prevalent in the informal sector in most developing countries. At the workplace workers' possibility to retaliate, if the employer reduces the wage, is low. Or, which can amount to the same, the worker is so vulnerable that she does not dare to speak up against unfair treatments in fear of the consequences of not having a job.
Welfare state programs may change such production relations (as discussed in Moene 2016). Workers would simply get more power and a higher voice. Vulnerable workers would become less vulnerable when they are net receivers of welfare benefits and support. The consequences of the sack become less severe when they are socially insured. The health of their kids is less dependent on own income when they have access to a public health services. Workers become better trained when the education system improves.
Welfare state programs that empower workers and increase their short term outside options and their long term life chances would also raise the lowest wages that the workers accept for working. As the lowest wage goes up, the inefficiency wage strategy becomes less profitable. Welfare state polices may in addition empower workers more directly. They may become more willing to stand up against unfair treatment and employers' abuse of their workers. Both higher wages and more worker power have implications for what jobs are most profitable to offer.
The profitability of bad jobs is high only when workers are weak and other wages are low. Empowering workers via welfare programs can put an end to this kind of employer dominance. It may at least transform some of the bad jobs into good jobs. When the profitability of applying inefficiency wages decline, the low wage strategy obviously become less attractive. In other words, the threshold level of productivity that separates good jobs from bad jobs goes down. Thus we get a lower number of bad jobs and a higher number of good jobs. In this way welfare spending leads to structural change with a higher productivity, a higher average effort, and a higher average wage. The changes are most dramatic at the bottom of the wage and skill distribution.
5.2.6 The impacts on job creation and job destruction
In our interpretation of the process of creative destruction (in section 4.1) we can interpret all this as an increase in the basic productivity of investment in modern technology. With more capable and healthy workers, the profitability of investing in high productivity equipment goes up as well. As long as this is the case, welfare spending is clearly complementary to capitalist dynamics in the form of real competition. It makes it profitable to invest in thicker layers of modern technology, generating higher average incomes. Workers become more concentrated in modern high productivity jobs. All this contributes to further wage compression as workers now work under more similar conditions. Higher average productivity also implies a higher common base wage to all workers.
We can connect some of this to the discussion of the process of creative destruction in section 4.x In that set-up the process was lead to more investment in each vintage (thicker vintages in steady state) the more profitable new investments are. Welfare programs that enhance worker capabilities and their productivity also increase the basic productivity of investment in modern technology. With more capable and healthy workers, the profitability of investing in high productivity equipment goes up as well. In this way welfare spending can complement capitalist dynamics in the form of real competition. It makes it profitable to invest in thicker layers of modern technology, generating higher average incomes. Workers become more concentrated in modern high productivity jobs. All this contributes to further wage compression as workers now work under more similar conditions. Higher average productivity also implies a higher common base wage to all workers.
So if this all this is right when it comes to job creation and job destruction, formal welfare programs lead not only to less informal economic activities and more formal economic activities, but also to a structural change of more modern production. This comes on top of the empowerment effect and the productivity effects. As long as welfare spending empowers weak groups in their life chances and that this empowerment provides society wide gains, a pressing question must be: how can one implement such a system in poor countries?
A first thought might be that since the basic gains come at the bottom of the wage and productivity distribution it is most efficient and fair to target the welfare programs as much as possible in favor of the worst-off groups. Yet both experience and sound theoretical reasoning in political economy suggest the opposite:
5.2.7 The needy benefit the most when welfare provisions go to everybody
The comprehensive cradle-to-grave welfare state in European countries (Scandinavian countries in particular) is based on rather universalistic programs. The programs have benefits that go to all citizens -- rich and poor -- rather than only to the poor. Politically the welfare state has benefited from this universalistic feature even though it is rather expensive. Universal spending gathers wider support in the population than more targeted programs.
A targeted program that has benefits that go to the needy only, would gather less support unless one can rely on stable and strong altruism in the population. The insurance aspect of universal welfare spending extends the political support way up in the middle class even among citizens who might pay more into the welfare system in the form of taxes than they expected to get out in the form of insurance benefits.
All these aspects are also important for implementing social policies in developing countries. One may ask which welfare state policy would lead to the highest empowerment of the poor and to the maximal reduction in poverty when the funding of the program is decided by majority vote in society? If the welfare budget was given, the answer is obviously the most targeted programs. But the welfare budget is endogenous and then it is not difficult to show that universal programs lead to the highest benefits also to the worst-off groups.
In fact, Moene and Wallerstien (2003) demonstrate that with targeted programs it is not clear that there would be any benefits to the worst-off groups in the absence of strong altruism in the population. There would be so little self-interest of such welfare programs from the middle class that the programs easily would vanish all together. Universalistic spending gather much more support from the middleclass and downwards, suggesting that programs that support everybody are the programs that allocate most resources to those who need them the most.
Another pressing question for the implementation of welfare spending is how the overall support for the programs is affected by changes in the income distribution and in the trust that people have in the public provider of welfare services.
5.2.8 Inequality erodes the generosity of welfare programs
It should be clear by now that the welfare state is nowhere a mechanism of pure redistribution from the rich to the poor. If it were, a huge inequality should generate high support for more welfare spending as the majority in any country earns less than the average income.
The welfare state has never worked as simply as that, which is evident from the observation that even in the developed world it is those countries with the smallest pre-tax income inequality that have the largest and most generous welfare states (Barth and Moene, 2015). Extending the picture to include developing countries, it is even clearer that countries with the most profound inequality and cleavages have almost no welfare arrangements at all (Lindert, 2004).
As emphasized already the welfare state is a provider of goods and services that the private sector often cannot supply equally efficiently, including social insurance, health care, and education. These welfare provisions are normal goods in the sense that the political demand for the provisions go up with higher income. The classification of welfare provisions as normal goods can be controversial for reasons that are not so easy to understand. A normal good is simply one that you like to have more of the higher your income is.
These public welfare provisions are paid for by taxes. The demand for the provisions by one specific individual therefore depends on how much she earns, in addition to how high the total taxable incomes in the country are. On top comes obviously her needs --- how vulnerable she is to shocks, and her sympathies for others who maybe worse off. Finally, her demand for public welfare provisions would also depend on her trust in the state apparatus and in her local public provider.
Keeping all other things constant and just raising her income would, I claim, raise her demand for welfare provision. Why? Simply because having a higher income she can afford more of many things that she likes, and also those that the welfare state provides, health services, education, pensions, and social insurance for her-self and others. With a lower income, her immediate needs would most likely be so pressing that she would be unable to pay much higher taxes to have more welfare provisions.
Now, with a lower income inequality for a given mean level raises the income to the majority of citizens. When the majority of the population gets higher incomes, a majority of voters demand higher provisions by the welfare state.
Above we discussed a case where structural change reduced in equality between good and bad jobs and where the average income was raised as well. In that case the political demand for welfare spending goes up both because the tax base (the average wage) increases, and because the individual wage to most workers within the majority goes up as well --- without necessarily altering the needs and risk that each person is exposed to. So, welfare spending becomes higher when inequality (before taxes and transfers) is low, reinforcing the initial wage compression via political adjustments and structural change.
Welfare spending is therefore one of the clearest examples of how equality creates support for more equality. In several connections this proposition has been tested. The results are clear: wage compression increases welfare spending (see Moene and Wallerstein 2001, Barth and Moene 2015, Barth, Finseraas and Moene 2015).
In fact, in North European countries this mechanism seems to be so strong that a generous welfare state is not dependent on a social democratic party being in power. It is rather the other way around: in order to win elections, political parties from across the spectrum have to shift their policies in a social democratic direction as wage compression shifts the political center of gravity. And, as incomes become more compressed both right-wing and left-wing parties shift their policies towards higher levels of generosity (Barth, Finseraas, and Moene, 2015).
Can this sunshine story of welfare spending hold in an unstable developing country where people don't trust the state apparatus, where there perhaps are dishonest and incompetent local providers who never forget themselves in allocating the benefits meant for others? Each of these features poses problems. Yet, they are common problems with all policies to be implemented in a country with fraud, favoritism and corruption, not only those of social provision. When institutions are extractive, they need to be changed no matter which policy is to be implemented. Thus anti-corruption policies must always be part of the strategy of development --- including strategies of social equality.
5.2.9 How equality can multiply
To have a realistic view of a welfare state for the poor, we have to incorporate how welfare spending is both fueled by and fuels income equality by empowering weak groups in the labor market and via structural change in the economy. The generosity of social policies narrows wage differentials by altering the power between groups and the dispersion of productivity in the economy. Both reactions lead to more wage equality. In the next round higher wage equality raises the political support for a more generous social policy by raising the income of the majority of the electorate.
This complementarity between social spending and earnings is an important example of the mutual dependence between politics and markets. It demonstrates how economic and social equality multiplies due to the complementarity between wage determination and welfare spending. Based on an elaborate model of these processes, Barth and Moene (2015) estimate an equality multiplier of more than 50 per cent, using data for 18 countries over 35 years. Any exogenous change in either welfare spending or wage setting is thus magnified in the long run by 50 per cent by endogenous forces caused by social complementarity. Comparison of countries show that the multiplier is highest in countries that start with a low level of welfare spending, like most developing countries to day.
The equality multiplier helps explain why almost equally rich countries differ so much in the economic and social equality that they offer their citizens, and why the divide in living standard between rich and poor countries may be widening. The equality multiplier can generate persistence of social policies. In the development context this may be good news as countries that embark upon social equality as a development strategy may be able to continue with the policy. The equality multiplier creates the conditions for further social improvements even with shifting governments.
Thus, it may be seriously wrong to think that a country must develop first and then, once it has become rich and affluent but not before, it can distribute the fruits of its development to all citizens. Yet many observers and policymakers insist that development must come first, redistribution and social provisions second. They seem to find it reasonable to think that it is important to become rich first, and next to redistribute the fruits of labor via welfare spending.
5.2.10 A good development path has continuous redistributing
First of all, ‘development first – redistribution later’ is based on an idea that we can postpone necessary policies of health provision, education and social insurance till the country is affluent. This is to give priority to private consumption for the better-off to an extent that is clearly absurd, and it might even undermine the ability to earn high private incomes as well. If I'm right that welfare spending have clear social gains for society in the form of empowerment and higher productivity, it must be important to start early with welfare spending. Postponement just means that the potential gains are wasted, that people are deprived of the benefits they could have had.
Secondly, it is based on the false assertion that becoming rich with a certain income distribution, does not affect the political ability to redistribute in the future. But economic development creates economic and political interests that tend to sustain the emerging distribution via the political processes. This is another aspect of political reinforcement where high inequality generates low support for redistributive welfare spending. So, postponing the policy can imply eliminating it all together.
As long as the political support for welfare spending declines as economic and social cleavages increase, and as long as a postponement leads to further increases this inequality (some get rich first), then it follows that the emerging richer upper-class may use the political power that their rising wealth entails to preserve their privileges and thus block reforms of generous welfare benefits to the worst-off majority.
Deng Xiaoping was seriously wrong when he suggested that the masses (in China) should accept that some people should become rich first. ‘Letting some get rich first’, may become a slogan for vested interests in policies that always let the same groups go first -- all of the time. Among those who benefited the most at the earliest stage of deregulation in China were officials of the Communist Party who quietly got rich -- fast. It is easy to understand that this kind of `corruption' creates strong political forces not to pursue social equality in the future. Egalitarian policies would reduce some of the huge rents that the political officials have obtained for themselves.
Generally, in all countries, letting some get rich first, before introducing welfare state arrangements, creates strong opponents of any egalitarian reforms of redistribution and empowerment. Those who become rich first are likely to favor other policies that maintain their privileges whether they are based on corruption, fraud, inheritance, or just unregulated capitalist markets.
5.2.11 Visible
The productivity effect of welfare spending emphasizes how the welfare state raises the labor productivity of poor workers who become stronger and more able when they are better nourished and protected, when they have better health and more education. The empowerment effect emphasizes how the welfare state enables weak groups to take more control over their lives, to be more resistant against shocks and deprivation, and better protected against the abuse of power by landowners and employers.
Therefore the head start of welfare spending is economically and politically advantageous. It can reap the benefits of empowerment and of higher productivity for a longer period. In addition, it can prevent that those who have improved their income status obtain high political power and a low willingness to help others for the collective good of the great majority.
In our view welfare programs for the poor in poor countries implies that production goes up, poverty declines, the profits from good jobs goes up while the profits from bad jobs decline This positive picture of the welfare state for the poor in poor countries contrasts some common views on welfare spending that focus most attention on visible costs. The beneficial effects are less visible. Often we cannot see them directly as they are based on a comparison with outcomes from circumstances that are no longer there, but that may quickly reemerge once we stop the spending.
To achieve some of this the benefits paid out by the welfare state need not be on Swedish levels in any absolute sense. The benefit levels have to be set in accordance with the local living conditions in the country. Perhaps one should search for policies that make welfare spending as a share of GDP more or less the same across countries, both rich and poor. This share may well be at the Swedish level. In any case, no country needs to be rich before introducing welfare state programs -- but they may become rich by introducing them.
5.3 Social safety nets and individual well-being in transition economies
What do the empirical literature say about the links between provision of social welfare and individual well-being? A wide range of studies show that individuals who live in countries with better and more widely shared safety nets and public health systems, among other things, have higher levels of well-being. Happier individuals with more positive outlooks for the future are not only more productive and healthier, but have better labor market outcomes over time (Graham, et al, 2004; DeNeve et al., 2013).
In contrast, several factors associated with persistent poverty not only undermine the productivity of significant sectors of today’s labor markets, but also those of the next generation. Inferior or inexistent public services and lack of social insurance, for example, and the associated stress due to constant uncertainty and circumstances beyond individuals’ control, can eventually have negative cognitive effects, which make it difficult for them to plan ahead, much less invest in their futures and that of their children.
A prime example which illustrates the linkages between social safety nets and well-being comes from the post-communist (or transition) countries, namely post-Soviet countries and China. In most transition economies, life satisfaction declined after the transition. The deterioration of the social safety net and the sudden exposure to market uncertainty following the transition is a key source of unhappiness and anxiety in these economies. Their experience informs policy decisions regarding the linkages between safety nets, state intervention and well-being.
Life under communism was predictable and secure. People were guaranteed jobs, and social insurance coverage was universal in its truest form. The transition to market capitalism removed the safety net that had protected the well-being of people and their families. For the countries of the Soviet Bloc, the transition process resulted in a massive economic collapse with GDP falling 50 to 85 percent of the 1989 level (Easterlin 2010). The job market, which had operated at virtually full employment under communism, deteriorated with double-digit declines in employment levels. Exposure to market uncertainty and risk and the privatization of the social safety net in such areas as health insurance and education left the people feeling vulnerable and insecure.
To take one example, Bulgaria was a country which relatively speaking thrived during the Soviet era, but is now the worst performing country in the EU (on the basis of GDP per capita in 2014). The plunge left the citizens with an identity crisis and a sense of inferiority accompanied by nostalgia for the communist past (Ono and Lee, forthcoming). Unfulfilled expectations, blocked opportunities, and rising inequality between the rich and the poor created a sense of injustice and threatened social integration (Boyadjieva and Kabakchieva 2015). Consequently, Bulgaria is one of the unhappiest countries in the world (Figure 11). More devastatingly, Bulgaria suffered a massive depopulation as disillusioned citizens left the country in large numbers. From its peak population of 9 million in 1988, the country has lost nearly 2 million people, mainly through out-migration. Although a direct link between life satisfaction and out-migration cannot be established, the case of Bulgaria illustrates one instance of how extremely low levels of well-being – both objective and subjective – can prompt people to exit.
Unsurprisingly, the decline in satisfaction in the post-communist countries is most acute in the life domains where support was assured prior to the transition (Easterlin 2010). For example, in the case of the former German Democratic Republic, the largest drop in satisfaction were found in the domains of childcare, work, and health. In contrast, gains in satisfaction were reported in material consumption, such as goods availability and dwelling.
Survey results taken after the transition underscore the people’s negative perceptions of the transition process. Exploring a large-scale survey of 28 transition countries, Guriev and Zhuravskaya (2009) report that half of the respondents in these countries believe that the transition did not bring any gains at all. Other surveys from the post-Soviet countries show similar results with the majority reporting that they were better off economically under communism (Czismady 2003).
Unlike the post-Soviet economies, China did not suffer from an economic collapse, but experienced unprecedented economic growth following the transition. Yet, life satisfaction in China actually declined during the same period accompanied by increases in suicide rates and incidence of mental illness (Graham et al 2015).
The deterioration of the social safety net is a key source of unhappiness in China. Like the post-Soviet economies, China’s path to market capitalism involved large-scale privatization of public services which weakened the existing institutional setting and destabilized people’s lives. Far from the universal healthcare that the people lived with under the communist regime, the majority of the Chinese population (mostly rural area residents) was left without health insurance prior to the health care reform of 2011.
The demise of the social safety net coincided with the timing of improved economic performance and rising aspirations in China. Many people, especially those who migrated from rural to urban areas, experienced relative deprivation as they faced blocked opportunities and unfulfilled expectations.
Higher inequality between the rich and the poor instilled feelings of injustice and unfairness. The transition benefited the rich relative to the poor in China. Survey responses by income categories taken in 1990 and 2007 show that life satisfaction declined in the bottom two income categories, but increased in the top income category (Easterlin et al 2012).
While the transition countries provide the most dramatic examples of changes in or deterioration of safety nets, there is a more general relationship between better public goods, environments, and social support and aggregate levels of well-being around the world (Graham, 2009; Helliwell, Layard, and Sachs, 2013).
There is less clarity on the relationship between well-being and the level and nature of safety nets, however. Different societies have different norms about the relative roles of individual versus collective responsibility in providing social insurance and social support. Some, such as the U.S., place much more importance on the former, and others, such as most European countries, place more emphasis on the latter. And in other societies, as in many Latin American countries, families play much more of a role in providing social support and help at times of need than they do in others (and particularly in contrast to the transition economies, where public institutions used to play an all-encompassing role).
Given these differences in social norms and families and social structures, it is not possible to propose a particular form of safety net or social welfare system that will increase aggregate levels of well-being world-wide. Yet societies with inadequate safety nets and economic and social systems which accentuate inequalities across socio-economic and racial cohorts clearly have lower levels of well-being than others at comparable income levels.
The US today is a case in point. A significant decline in the availability of low-skilled jobs combined with inadequate social support for the unemployed is increasingly associated with widespread desperation and lack of hope among some cohorts (poor whites in particular). This ill-being is reflected in an increase in preventable deaths (suicide, opioid and drug addiction, and diabetes) and is driving up overall U.S. mortality rates (Case and Deaton, 2015; Graham, forthcoming).
Adequate social support for those who fall behind is an essential element of happy and just societies. The nature of that support will vary across societies, reflecting social norms on the one hand and economic and institutional structures on the other. Societies which fail to provide the institutional and economic resources necessary are much more likely to perpetuate or exacerbate injustice and to have significantly lower levels of well-being.
5.4 Ownership Models: Democratizing Economic Organizations
Much of the discussion thus far has focused on national level analysis of social justice and well-being. In the following subsections we look at how social justice outcomes have been produced at the regional scale by non-state as well as state-led actions. The cases discussed offer strategies for social progress that highlight socio-technical assemblages that have provoked the emergence of new social norms, non-capitalist economic organizations and the ethos of solidarity in place. They offer insights into mechanisms for achieving social progress at the grassroots that can travel out to different contexts and be activated at more encompassing scales.
Material wealth is created in a variety of organizational contexts including capitalist business enterprises, sole proprietorships, cooperatives and hybrid enterprise forms as well as in households, neighborhoods and communities. Feminists have long established that the material stuff of life is not only produced in commercial contexts but also domestic and civic settings. Technologies for inventorying and tracking non-monetized wealth and its distribution have only recently been developed (Waring, date) and are as yet not clearly linked to social justice producing mechanisms.
One set of interventions to create more socially just ways of distributing material well-being have focused on democratizing the appropriation of social surplus within economic organizations involved directly in wealth creation. From a heterodox economic point of view what is produced over and above what is needed by the economically active members of a society for their material survival is deemed social surplus (also known as wealth). This social surplus is what is available to support the material well-being of those who do not produce material necessities but who contribute to societal well-being in myriad other ways (so called ‘dependents’ children, the aged, the disabled and those who are studying and training; administrators, cultural workers, health providers, protectors and so on).
Collective sharing of social surplus may in principle take place in many ways. We first give a brief presentation of profit-sharing arrangements before we move to sharing of wealth within the private realm of employee owned businesses, worker owned cooperatives and social enterprises. Sharing of wealth is supported by legal infrastructure that works against the purely private appropriation of surplus. To what extent these enterprise interventions create social justice in terms of equality and solidarity beyond the firm is debated. What they do achieve is some measure of redress of the economic injustice of surplus appropriation by private capitalists.
5.4.1 Alternative pay schemes: sharing profits with employees
Profit-sharing is not a very radical change compared to traditional wage economy. It consists in compensating workers with a share of the profits per worker as part of their pay. The profits that are shared are calculated with a certain fixed base wage and workers get a share of the profits in addition to this base wage. In the most simple form profit-sharing means that workers have a contract to obtain part of the surplus created, but without any decision making rights or democracy at the work place. Whether this actually means that workers obtain higher earnings compared to what they would have achieved with traditional wage labor depends on how high the basic wage is.
Profit-sharing is not a new thing. It is an old arrangement used in many capitalist enterprises way back in the 17th and 18th century --- both in the US and in Europe (at least in France and England). For instance, many British coal mines introduced profits-sharing around 1860. The arrangements were popular among workers as long as profits were high and increasing. But when times became bad and the mines had declining profitability, the arrangements became unpopular and they the coal mines eventually canceled the system. Recently profit-sharing has been used a lot in Japan and South Korea where profits-haring can constitute around 30 per cent of the total pay per worker in large companies.
After the publication of Martin Weitzman’s The Share Economy in 1984 there was a heated debate about the functioning of profit-sharing as a remuneration system. Weitzman’s claim in the book is that with profit-sharing in a capitalist market economy would generate a ‘suction equilibrium’ in the labor market. By the term suction equilibrium he meant a state of excess demand where each profit-sharing firm would hire more workers if it could find any, but where no firm has reason to change the wages.
To illustrate how this kind of booming employment can arise, think about book sellers hired by publishing houses. They are normally compensated by 30 per cent of the value of each book they sell. Accordingly the publishing houses earn a gross profit of 70 per cent of each book sold. Adding an additional seller would only increase profits and publishing houses would therefore like to hire as many booksellers as possible. Each of the already hired booksellers, however, would not like the entry of new ones, making it more difficult to sell books. Yet the publishing houses can’t lose anything by hiring an extra seller. He would costs nothing if he does not sell any books, and from every book he sells the publishing house gets 70 per cent of the value.
One of the authors of the present chapter tried to check whether this was a true description of how the bookseller market actually worked. He contacted the publishing houses in his home city and asked whether they would hire him as a seller. Without further checks they were all willing and extremely eager to employ him. Even when he admitted that he was employed by the university, and that he only investigated how they hired booksellers, they did not give up, insisting that it was possible to work in the evenings in addition to the university job and so on. He concluded that that all booksellers were willing to employ any idle person without further ado --- the suction property.
The more interesting question, however, is whether it would work equally well to introduce profit-sharing contracts in all enterprises in the entire economy. Perhaps the suction properties of the macro labor market would persist, guaranteeing a path close to full employment. Yet it would come at a cost. With profit-sharing workers are invited to bear part of the risk of fluctuations in the output markets shifting risks from capital owners to workers. The risk borne by workers would also include the risks of management failures. More democratic and participatory models of worker management would correct some of these weaknesses. Yet, it is an open question whether the suction properties of profit-sharing can be maintained with more participatory management.
5.4.2 Employee Ownership: sharing wealth with employees
Employee ownership is a much more radical arrangement. It may increase economic justice by broadening the number of owners of business enterprises through shared ownership with employees. There are many varieties and grades of employee ownership. In the US there extensive employee stockownership plans (ESOPs) where employee ownership is highly inegalitarian within the groups of worker owners.
The UK Nuttall Review of Employee Ownership, Sharing Success (2012), defines employee ownership as
a significant and meaningful stake in a business for all its employees…. What is ‘meaningful’ goes beyond financial participation. The employees’ stake must underpin organisational structures that ensure employee engagement. In this way employee ownership can be seen as a business model in its own right. (Nutall, 2012: 74-75)
Whether employee ownership is an intervention that promotes radical transformation of the conditions under which widespread social injustice is created is debated. However, it is a strategy that foregrounds the right of employees to claim a share of the profits of business. The well-being of employees in employee owned businesses is reportedly higher than in non-employee owned businesses and this increases in companies that “provide employees with a greater stake and involvement in long-term collaborative goals” (Nutall, 2012: 29).
5.4.3 The Mondragón Example
Much has been written about the cooperative economy that developed in and around Mondragón in the Basque region of Spain during the 1950s and continues to thrive (e.g. Gibson-Graham, 2003; Redodno, et al 2011). Today strategies of the Mondragón Cooperative Corporation (MCC) are being emulated in many locations around the world where capital flight and deindustrialization have left communities bereft of livelihood opportunities. The key element of the Mondragón model is direct worker ownership of production and distribution enterprises and indirect ownership of financial (banking, social provision and insurance) and knowledge (research centers, a university, vocational training and schools) institutions that support the regional economy. Social justice is embedded in wage structures (no more than 1:6 difference between lowest and highest wage in any business), decision making (one member, one vote), surplus management (vested in the business or bank to allow for expansion of coops and cooperative employment), welfare provision (access to health and social insurance) and the built environment (a unique urban fabric of co-located high density housing, sociable public spaces, goods and service outlets and places of employment).
A commitment to people before profit (the subordinate and instrumental character of capital) lies at the core of the Mondragón economic system. But how did it become a shared commitment with the power to shape business practices? How did a discourse of social justice and the dignity of labor become a performative reality-shaping technology? From an STS perspective it is important to identify the networks that pre-dated and co-evolved with the sociotechnical assemblage we now recognize as the Mondragón model and the metrologies that continue to support its social justice ethos.
Ideas drawn from Catholic teachings and the writings of late 19th century social theorists were introduced into the Mondragón community by the local priest Father Arizmendiarrieta who, some 15 years before the first worker owned cooperative was started in the mid-1950s, conducted reading and discussion groups with young community members. In addition to these study circles, Arizmendi fostered sporting and activity clubs that provided neutral spaces where deep personal and political antagonisms enflamed by the Spanish Civil War could begin to heal.
So when the first manufacturing plant was opened as a worker owned cooperative this experiment rested upon a network of associations that had built trust and a shared commitment to cooperativsm. In the ruins of post-war destruction and in the face of Franco’s vindictive economic disenfranchisement of the Basque region the initial cooperative used basic technology to produce affordable kerosene cookers and heaters to sell to local consumers. Now, one of the most advanced manufacturers in Europe, the MCC has always put people not only before capital but before technology. A transparent accounting system was developed to manage surplus allocations and over the decades it has been usefully deployed to facilitate retooling and manage job loss without employment loss (Gibson-Graham, Cameron and Healy, 2013).
There are clear limits to the Mondragón social justice sociotechnical assemblage, but its boundaries are fluid. Temporary workers and non-co-operators are encouraged to take up membership as full co-operators when it is financially feasible and the assemblage can expand without undermining its resilience. This is a case in which state policy excluded the Basque region and forced communities to develop their own survival pathway. It stands as an example of bottom up social justice achieved by non-capitalist economic organization.
5.4.4 The Kerala Example
The example that we focus on here shows how self-management can implement gender justice at an regional scale in the state of Kerala in India. Kerala has 33 million inhabitants. The population consists of 60% Hindus, 20% Muslims and 20% Christians. While poor by standard measures of per capita income, the population is rich by other measures.
The average life expectancy is 73 years for males and 75 years for females, comparable with that of the US (and some 10 years higher than for India as a whole). Some 94% of births are attended by health professionals and the infant death rate is lower than that for African Americans in Washington DC. The total fertility rate is two births per woman and the population growth rate is below replacement level. Compare this to the 1950s when Kerala had the highest population growth rate in India. These demographic changes have been achieved without the coercive state practices pursued in China or the rest of India that have reduced population growth, but seen the rise of abnormal female to male sex ratios. In India as a whole this ratio is 91 women to 100 men. In Kerala, for every 100 men there are 109 women (Gibson-Graham, Cameron and Healy, 2013).
In the State of Kerala and, prior to the 1950s, in the princely states of Travancore and Cochin there has been a history of investment in mechanisms that produce social justice. Governments have prioritized land reform, food security and mass health and education programs targeted to the poor, women, scheduled castes and rural residents. What explains this longstanding commitment to investing in social advancement in a society where ethnic diversity might easily have been a barrier to public goods provision?
An STS (see section 3.7) perspective helps shed light on the configurations at work here. As with the Mondragón case, there are antecedent associations and networks that sowed the seeds of an egalitarian discourse in Kerala in the early 19th century. Christian Protestant missionaries preached the “equality of humans before God….[and] questioned the creedal bedrock of caste” (Singh, 2010:290). They made education available to lower castes and women, and though the numbers educated were small, there were enough “politicized, economically mobile members of lower castes with an English education” to fuel leadership of a sub-nationalist movement against ‘foreign’ (i.e. non-Malayali Brahmin) ruling elites. The late 19th and early 20th century movement to consolidate all Malayali speaking regions into a single state used signature campaigns, petitions and public rallies to generate popular support. These technologies helped generate a “Kerala-wide consciousness of shared community” (Chiriyankandath, 1993:650 quoted in Singh, 2010:284). Since the State of Kerala was formed in 1956, state governments, many of them Communist led, have vigorously pursued social policy with a “pronounced redistributive emphasis” (Singh 2010:287).
The shared community has informed mass programs of volunteer action. In 1989-91 the Total Literacy Campaign recruited 350,000 volunteer teachers to target rural illiteracy. Volunteers learned from doctors how to match 50,000 pairs of donated eyeglasses to recipients with bad eyesight. The effect of this concerted effort is an official literacy rate today of 90%. Throughout the decades, women’s literacy has been particularly targeted. When women are literate it is more likely that all children, not just boys, are also literate. And when women are educated the transition from high to low population rates is much more likely to occur.
An unfortunate consequence of the better wages and conditions achieved by workers in Kerala is that factories have moved to cheaper regions in India. There are high rates of unemployment and underemployment. Many educated Keralites seek employment overseas. Physical health across the board has improved dramatically, but mental health problems remain, including high suicide rates. Though mainstream economists are unhappy with Kerala’s low rate of economic growth, others are intrigued by the experiments with a non-mainstream kind of economic growth being pursued here. Can the stabilized population and commitment to fairness and redistribution be ingredients for a low wage future built around a good life?
In Mararikulam, one of Kerala’s poorest areas, some 15,000 neighborhood savings groups, each made up of between 20 to 40 women, are transforming themselves from credit associations to production cooperatives. Small amounts of money saved by 17,000 women have yielded enough to capitalize a range of producer cooperatives making soap, school items, coconut coir products and food. In 2002, 30,000 women took the Maari soap pledge to buy locally produced Maari soap rather than imported brands. And in 2008, 300 representatives from 100 local governments in Kerala signed the “Mararikulam Declaration for Self-Sufficiency in Vegetable Production.” They pledged to support women’s participation in organic vegetable farming and they diversified crop production to achieve food security in the foreseeable future. A new sociotechnical assemblage is forming in which the production of relatively low tech products that serve daily needs is backed by a complex network of financial instruments and consumer commitment still motivated by a sense of shared community.
5.4.5 The Indian Self-Employed Women Example
The Self-Employed Women’s Association (SEWA) was born in 1972 of Gandhian principles and trade union tenacity in the same streets that earlier ignited the Indian Independence Movement. For more than four decades, SEWA has been working with poor self-employed women, enrolling them into a union association that helps them improve their livelihoods through various initiatives in training, microfinance, market linkages and natural resource management, across a number of trades. Today, SEWA is a member based organization of more than 2 million poor self-employed women workers spread across 14 states in India.
The work of SEWA is based on the core beliefs that economic empowerment leads to social justice, that work must contribute to growth and development of others, and that the decentralization of economic ownership and production creates a more just society.
SEWA focus on economic empowerment. Its extensive experience in working with marginalized women at the bottom of the pyramid has shown that the surest way to ensure social justice for an individual is to invest in her economic empowerment. When a marginalized woman gets the support and obtains the ability to increase her income earning potential and uplift her family, she is empowered socially as well. She gains confidence in her dealings with her family, her co-workers and members of her community. She earns respect from her family and the community, and is often able to transcend societal barriers imposed on her on account of tradition, custom, caste and religion. She is also able to access more and better opportunities. Being able to earn a dignified livelihood has a transformative and sustainable impact on a marginalized woman and her family.
SEWA has a relational view of work. Its interpretation of work is derived from Indian philosophical thought that conceives the work of an individual in relation to the environment. Whatever we consume is taken from the world and so something has to be put back into it. In relation to the natural world, this obligation is interpreted as the need to conserve and the need to replenish. If a tree is cut down, one needs to be grown in its place. In relation to the social environment, it is seen as the need to contribute to the growth and development of others. SEWA’s experience has shown that working for others, and especially for the most vulnerable, creates a force that builds a movement that leads to social justice. SEWA’s leaders are elected from among the members. To gain leadership positions, they must be accepted by the most vulnerable members. These women are also the ones who become loyal and active, and become the life force of the movement.
SEWA works for decentralization of ownership and production. A more just society requires that ownership of economic resources be distributed more equitably. Within most countries, the distribution and ownership of wealth tends to be concentrated in certain areas, and generally the wealthier areas attract more resources and the poorer areas lose them. Economic decentralization is one way of distributing resources. Reaching the poorest has been a major administrative exercise when organized on a national level. SEWA believes that a more efficient system would be one where food, clothing and other minimum requirements are distributed locally. Even more efficient would be local production of required needs. New technologies and inputs could bolster this production and encourage backward and forward linkages with mainstream markets.
The strategy of decentralization is connected to SEWA’s idea of ‘holistic work’. In many societies, especially among women, work is satisfying and creative if it is part of communal life. Decentralized production gives communities greater control over what they produce and how it is used. One good example of the holistic nature of decentralized work is found among communities who live in areas rich in natural resources such as forests. Where communities have a greater control over these resources, they tend to preserve and regenerate these resources. This holistic perspective requires that the individual gives back something to the world, even as she takes away from it for her maintenance. Building such interdependence requires a strong sense of local community and culture that integrates the economic and social realms.
Local production and distribution also strengthens the economic role of women. Much of their work is non-monetary and meant for use within the family. Much community work that involves maintaining social relationships is also done by women. Economic decentralization leads to two trends that are beneficial to women. It strengthens local markets and local skills and makes markets more accessible to women. It raises the value of non-monetary work, including all forms of community and service work, and this work acquires a more holistic meaning and comes to be understood as work done for the maintenance of the society.
SEWA’s mission to empower its marginalized members and lift them from poverty is driven by two specific goals – bringing full employment to its members, and making them self-reliant. Full employment means that in addition to income, members obtain food, social security, health care, child care and shelter. Towards this, SEWA adopts an integrated approach with four specific strategies:
- Organizing women: As individuals, poor women have little or no voice. Together they become strong, gain confidence and bargaining power, and become capable of great achievements. SEWA organizes its members into savings groups (federated at the district level), producer groups, cooperatives and producer companies, and provides continuous handholding support to these entities to achieve their respective objectives.
- Building new skills and capacities: SEWA works to continuously build capacities, skills and leadership, and encourages women to become part of the decision making process at home and in public. SEWA strives to encourage women to become owners and managers and not just producers and laborers.
- Encouraging capital formation: SEWA encourages women to create assets at the household, group and community levels to fight vulnerability, and improve access to affordable finance.
- Increasing social security: To enhance women’s well-being and productivity, and reduce the impact of crises on the fragile household economy.
Many of SEWA’s economic programs are driven by institutions, and often managed by grassroots women. The SEWA Bank, for example, was founded in 1974 after 4000 poor self-employed women contributed share capital of Rs. 10 each. They registered the Mahila SEWA Cooperative Bank under dual control of the Reserve Bank of India and the State Government. Since its inception, the SEWA Bank has been bringing affordable and customized financial products to the informal sector that is otherwise excluded from the formal banking set up. So far, SEWA Bank and SEWA’s District Associations (members’ own economic institutions at the district level) have given loans amounting to a total of over Rs. 100 crores ($15 million), freeing grassroots women from the clutches of exploitative moneylenders and helping them invest in productive activities. The total deposits of grassroots women (as well as savings groups) with SEWA Bank amounts to over Rs. 172 crores ($26 million).
The SEWA Manager ni School (SMS) was born in 2005, an all women organization dedicated to provide training and skill building programs to micro-entrepreneurs in the informal sector. SMS began by providing a range of managerial trainings to grassroots executives and managers to help them prepare business plans for their respective economic organizations and drive them towards sustainability and profitability. Over time, the curriculum has expanded to a wide range of technical, vocational, managerial and leadership skills. Today, SMS is a professional skilling organization with relevant and effective training modules and an efficient technology-driven delivery mechanism. Since its inception, SMS has trained over 1.5 million people in various subjects. Key to the SMS model is its cadre of 5000 master trainers, drawn from grassroots members and trained in technical, managerial and pedagogical skills. These trainers also function as local resource persons for micro-entrepreneurs, effectively providing them handholding support.
The Rural Distribution Network (RUDI) is SEWA’s pioneering initiative to find a sustainable local-economy based solution to address food security through an institutional model managed by poor informal sector women. RUDI, as the name suggests, is a predominantly rural distribution chain which procures farm produce from marginal farmers at market prices, processes them and sells them in the villages at affordable prices. The supply chain employs hundreds of poor women, with women involved at every stage of the chain. The management is handled by the women themselves. RUDI also stands for a brand which has come to signify affordability and high quality. SEWA has piloted RUDI in several of the districts in Gujarat and has found it to be a model immensely successful in addressing food security concerns among rural households. Today, RUDI has organically grown to a point where it now reaches over a million rural households annually with packaged agri-products worth over Rs. 3 Crore ($450,000).
SEWA has been at the forefront of using technology to empower grassroots households/communities and promote social justice. Over the past decade, SEWA has demystified technology for its members, piloted several ICT based innovations and empowered thousands of rural women. For example, in partnership with private organizations, SEWA has piloted custom mobile or tablet based applications that digitize transactions conducted by each SEWA grassroots leader (aagewan), thereby reducing her travel time, improving her efficiency and increasing her income generating ability substantially. The aagewan today logs into the application with her username and password, and is presented with a list of allocated villages and savings groups that she has to visit, from a central database. As she collects installments or premiums from the groups, she ticks their names on the application, and with a Bluetooth linked printer, presents a receipt to the members.
To help farmers form better harvest price expectations at the planting stage and thereby make better planting decisions, SEWA instituted an SMS-based information dissemination system that brought to the marginal farmer’s village futures’ and spot price information of the relevant crops from the commodity exchange. Over a pilot period of 3 years, SEWA extended this information system to over 150 villages linking over 7500 marginal farmers with spot and future prices information.
In two districts of Gujarat, SEWA has set up community radios, identified talented individuals from among its members and set up a programming team. The team has recorded (and is broadcasting) over 1600 hours of programming on various topics relevant to the district, such as agriculture, health, government schemes, weather information, social issues, local music and so on. The SEWA GIS system in Vadodra district of Gujarat has mapped local natural resources, helped in identification of water conservation solutions and creation of appropriate cropping strategies. This system arms the community with relevant information with which they can approach the local government (panchayat) and implement solutions for their villages. Finally, SEWA is pioneering tele-medicine and tele-agriculture with doctors and agriculture experts in cities being linked to members living in remote villages through internet-based conferencing tools.
It is instructive to consider SEWA’s 11 questions to monitor whether they are moving towards social justice or not. To ensure that SEWA is moving in the direction of the twin goals of full employment and self-reliance, constant monitoring and evaluation is required. In a membership-based organization, it is the members’ priorities and needs which necessarily shape the priorities and direction of the organization. Hence, it is appropriate that members’ themselves have developed their own yardstick of evaluation.
The following eleven questions have emerged from discussions with members and continually serve as a guide for all members, group leaders, executive committee members and full-time organizers at SEWA. It is also useful for monitoring SEWA’s progress and the relevance of its various activities and their congruence with our members’ reality and priorities. It also leads to increased accountability of SEWA’s leaders and organizers to the members. The eleven questions of SEWA are:
- Have more members obtained more employment?
- Have their incomes increased?
- Have they obtained food and nutrition?
- Has their health been safeguarded?
- Have they obtained child care?
- Have they obtained or improved their housing?
- Have their assets increased? (like their own savings, land house, work-space, tools of work, licenses, identity cards, cattle and shares in cooperatives and all in their own name.)
- Has the workers’ organizational strength increased?
- Has workers’ leadership increased?
- Have they become self-reliant both collectively and individually?
- Has their education increased?
5.5 A more democratic and less in-egalitarian capitalism
Democratic capitalism is a system in which individuals have the freedom to trade with each other, at mutually agreed prices, and this includes trading their labor for wages, and the creation of new privately owned firms that can hire workers and sell their output.
In advanced capitalism, large firms are owned by shareholders, who risk equity (their savings) and share in the profits of the firms, if there are any. Typically, advanced capitalism becomes extremely economically unequal, as we have described above. The market system does not provide all goods efficiently, even if it is very competitive: social insurance is not provided well by markets, nor are public goods, nor are public bads properly regulated by markets. Social insurance and public goods must be provided by the state, and states collect taxes from citizens to finance their activities. How can democratic capitalism become more egalitarian? As we have seen, to answer we need to consider some basic issues about opportunities, pay and taxes, wealth and incentives --- institutions and social organizations.
5.5.1 Taxes and excessive rewards
States can limit the accumulation of wealth by taxation, typically income and wealth taxation, though other forms exist as well (such as consumption taxation). Of particular importance is estate taxation, for without it, inequality of opportunity necessarily exists for the children of the original generation, some of whose members can pass down huge estates to their children. For a society that values equality of opportunity, it is therefore mandatory to have stiff estate taxation. For the same reason, the wealthy will oppose stiff estate taxation. At present, we can say estate taxation is in its infancy, and this means we have not attacked one of the principal causes of inequality of opportunity.
Estate taxation is a form of wealth taxation, which is generally poorly developed at present. Most countries have taxation on real property, but no taxation of financial assets (stocks and bonds). In many countries, capital gains ( a form of income, because capital gains are a change in the value of wealth) are not even taxed – sometimes these taxes may be avoided forever, as in the United States, where an heir need not pay capital gains on the stock that has accrued on the donor’s investments during his life[16]. Thomas Piketty (2014) advocates unified taxation of all kinds of capital globally: even a small tax would provide the considerable value of providing us with a balance sheet of the distribution of wealth in the world, which we do not possess at present. Indeed, the good figures we now have on income distributions in many countries, and which Piketty and his collaborators have exploited to great effect, exist only because of income tax records.
There are two questions regarding the accumulation of vast fortunes that occurs under capitalism: is this accumulation just, and is it necessary? Many people believe it is unjust, but far fewer believe it is unnecessary. For the ideology of capitalism stipulates that only by allowing the vast accumulation of wealth will we have the innovation and high standard of living that capitalism has brought about. The popular term for this view is ‘trickle-down.’ The income that the great mass of us enjoy trickles down from the huge value created by a very small class of innovators and entrepreneurs, and if we interfere with their activity, their good innovations will cease, and we will all become poor. The neo-liberal view has it that any restriction of markets will have this effect, and so we must allow unfettered capitalism in order to enjoy the high living standards that characterize today’s successful capitalist countries.
There is, however, a slip in this argument -- a slip between what free markets will provide to entrepreneurs and innovators, and what incomes these creative people must receive in order to carry out their socially important functions. In a competitive market, an individual receives an income that is equal to her marginal product, which means the difference in the value of output that she contributes. The logic that proves this claim is the following: if A can produce a marginal difference of $10,000 in revenues in firm a, and firm a offers A $8,000 as payment, another firm b will come along and offer A $9,000 to do the same work – and b will still make a profit of $1,000 from A’s labor. Thus if firms compete for valuable labor, they will bid its price up until A captures her marginal value to the firm. (Strictly speaking, the firm is then indifferent as to whether or not it hires A.)
Now consider the Board of Directors that is looking for a CEO to run a huge firm H, whose annual sales are $100 billion.[17] The firm has pruned the short list down to Oscar and Ellen. After much discussion, they estimate that Oscar will add $5 billion to the firm’s annual sales, and Ellen will add $8 billion. The Board’s guess is that Ellen marginal product over and above their next best alternative is $3 billion. Is it surprising that Ellen can bargain for a salary of, say, $20 million a year?
In other words, it is perfectly conceivable that the salaries of CEOs of the largest firms are set competitively. This is because Ellen’s talents are to a great extent transferable. Although no firm produces exactly what H produces, there are other firms J and K that need executive talent like Ellen’s also, and these firms will bid her away if she does not receive a huge salary.
In the world at present, the CEOs of American firms are usually the highest paid. This may well be because in other countries, such as Japan and Germany, there are social norms that prevent executives from being paid this much. After all, fifty years ago, when firms were smaller, the ratio of the CEO pay to that of the average worker was closer to 30:1. Now in large firms it is about 300:1. It is also because the capitalist ethos has developed more pervasively in the last fifty years. Americans might well have rebelled at the stratospheric pay of CEOs in earlier days, but now greed is morally permissible. In addition, the growth of the size of firms (more precisely, their revenues) contributes to huge CEO pay, because the predicted marginal contribution of the CEO has become larger.
From the social viewpoint, it is extremely unlikely that Ellen would not perform her executive job were she paid, say, $1 million a year, or even less. But to lower her salary to that extent would require international cooperation. This lowering could be accomplished most easily through taxation: taxing incomes above $1 million at a rate of 95% or higher. Such tax rates would discourage firms from offering executives such high salaries – what would be the point of simply transferring wealth to the state? Consequently the profits of the firm (after payment of all wages including CEO salaries) would be greater, and we have not yet addressed how those would be distributed. However, to prevent Ellen from moving to higher paid positions, high tax rates would have to be internationally implemented – or at least implemented in those countries that domicile firms that are large enough to pay these salaries.
After all, if the Ellens of this world can earn ‘only’ $1 million a year as CEOs, would they rather ‘take leisure,’ write poetry or play golf? Almost certainly not. Their positions as movers and shakers give them great self-esteem and the respect of others: indeed this respect might even increase if a social ethos developed, and CEOs were to view their jobs as social contributions rather than positions for the accumulation of personal wealth. Clearly, however, organizing this reduction in large salaries requires international coordination of tax policy, as long as the capitalist ethos prevails.
5.5.2 Ownership
We now address the concentration of ownership of firms, and hence the accumulation of wealth by those who earn capital income, as opposed to labor income (for Ellen’s salary, gargantuan as it is, is still labor income). If salaries become lower through labor-income taxation, of course private wealth will accumulate more slowly as well. There will be a transfer of wealth from private accounts to public accounts: the state treasury.
We believe the question of how the nation’s firms are owned is a more difficult one to address than the problem of preventing huge salaries of CEOs – and it is CEOs and top people in finance who by and large populate the top 0.1% and 0.01% of income earners in the population. (Highly paid athletes, movie stars, and some professionals comprise only about 5% of this group.) Currently the concentration of ownership of large corporations is extremely concentrated in the hands of those at the top of the wealth distribution. Most people in advanced capitalist economies own no equity in firms, except possibly through the investments of their retirement funds. By far the largest investment of most households is in their house.
Because markets are necessary, as we have argued, entrepreneurs will form small firms, and the successful ones will grow. To prevent the concentration of wealth, at some point the ownership of these firms must change. The state must nationalize the firm, paying the owner properly for his development of the firm. Indeed, the erstwhile owner may be the best choice for the CEO of now publicly owned firm! After all, he created it, and knows the ropes. He will, in this case, receive a salary, but the profits of the firm will now escheat to the state treasury.
There are a number of other possibilities: the state can encourage the creation of worker-owned firms, through taxation policy. There may develop firms that are owned by other local government institutions. The sector of non-profit firms may grow.
In our view, the role of firms owned by national and state governments will be important: indeed, this form probably must characterize highly capital-intensive firms. In the United States today, the amount of capital per worker is approximately $300,000. In the most capital-intensive firms, it is considerably higher. If workers were to organize such a firm as worker-owned, each would have to invest this amount in the firm. Workers would have to finance this investment with loans, and it would be highly irrational for a worker to have all his wealth tied up in his firm and his house. So it is probably not the case that highly capital-intensive firms can be worker-owned.
As noted a system like Mondragon (see section 5.4), a large community of worker-owned firms, would be more rational. In such a community, workers could have stakes in the whole community of firms, diversifying their risks. Outside finance could be used, although it is an open question to what extent bondholders would require some control of the firms in order to purchase their bonds, which would compromise worker ownership.
The purpose of the various ways in which firms could be held would be to realize a distribution of capital income in the nation that would be approximately equal. It would not be possible without draconian restrictions to keep capital income completely equal, but it might be possible to limit the ratio of capital income of the richest to the poorest to ten or twenty to one. Recall that a significant part of the capital income of each citizen will be received as expenditures by the state on goods financed by the profits of publicly owned firms which pass through the state treasury.
Besides the equalization of income that would occur if wage differentiation and capital-income differentiation were sharply reduced, there is an important macroeconomic effect of such a distribution. Suppose household i receives a share of the labor income of the nation and also share
of the capital income of the nation. Then it receives share
of the net national product of the nation (which is the sum of labor and capital income), so its economic interests are to increase the nation’s net national product. This is quite a different incentive from the ones people face if some receive only wage income and some receive only capital income. For example, it will be much easier for workers to understand that their interests lie not only in increasing their wages, but in increasing the profits of state-owned firms. It should be much easier to organize an all-encompassing trade union federation representing all the workers of the nation, because they have a common interest in increasing net national product. Now to the extent that a household receives a different share of the nation’s labor income and capital income, it will no longer be the case that its economic interest is to increase precisely the net national product, but the incentives will still be better than if some receive only labor income and some only capital income.
5.5.3 Transformation
What kind of transformation could bring about an economy of the kind we have been discussing? Would it be revolutionary or evolutionary? How rapidly would economic arrangements change? Our view is that changes would be and should be evolutionary rather than revolutionary. There are two principal reasons for this. The first is that we are supposing that democracy already exists in the capitalist country we are discussing, and hence changes must come through democratic methods, which will necessarily be gradual and incremental. The changes we have discussed will surely be the result of sharp political competition between the wealthy class, which will fight to protect its wealth and political power, and the rest of the citizenry. We reiterate that we do not have a crystal ball showing us that such changes will indeed come about: rather, we have outlined what we believe is a feasible and desirable path.
The second reason is that the organization within firms, and the networks among firms comprise an extremely valuable part of the nation’s infrastructure, like its highways and electricity grid. It would be folly to destroy these and attempt to rebuild new intra- and inter-firm structures. Just the way an auto factory can be rapidly retooled to produce fighter jets during wartime, so we believe that the existing firm infrastructure which modern capitalist nations have built can be retooled quite easily to accommodate a new set of property relations. To some degree, what firms do will change gradually, as the new property relations gradually induce a new social ethos among firm employees and management.
The one exception we see to this recommendation concerns the financial sector, which in many advanced capitalist countries (particularly the United States) is far more important than it should be. The financial sector has changed from one that provides an important service – namely, matching savings of some to investment projects of others – to one whose raison d’être is to make rich people richer. We believe that the recent financial crisis was a consequence of pyramid schemes that the American financial sector constructed (primarily in the sub-prime housing market) in order to produce high returns for the savings of the wealthy. Of course, there would be no place for such shenanigans in the economies we are envisaging. The financial sector must return to its former role, and this would be accomplished through legislation. Whether maintaining such a role would require that banks be publicly owned (as they are in some capitalist countries) or not is a secondary question.
To review, we have proposed a transition path for present-day capitalist countries that is democratic and incremental, not revolutionary, whose goal would be to produce an economy in which every household received not only labor income, but a significant fraction of its income from capital, that would come either from being a member of consortium of labor-owned firms, or through consumption of goods financed by the state with the profits of publicly-owned enterprises. We believe the market economy is essential, and therefore we cannot hope to have complete income equality.
We believe, however, that the material incentives that markets provide need not be as extreme as they are at present, producing a very small wealthy class that owns a huge fraction of the nation’s wealth. The reason for this is that occupations that pay very high salaries are ones that are intrinsically interesting, and garner great social approbation. It is not the need to live in 1000 rooms that induces the very rich to live in palaces, but the need to show others how successful and important a person one is. If there is international tax coordination, those with certain rare talents will continue to employ them for the benefit of us all, they will not live in palaces, but they will be content for the social approbation they receive. This applies to superstar athletes as well as superstar managers, surgeons, and lawyers.
We do not believe, however, that this kind of economy, with its relatively equal income and wealth distribution, can survive unless a social ethos replaces the capitalist ethos that is currently prevalent, although far from universal, in today’s capitalist countries. There are many who already have a social ethos – one finds them in various professions, but largely in the helping professions (social work, nursing, teaching, care for the elderly and the very young). As one might expect, those with a capitalist ethos enter occupations where they can earn high incomes, and so the presence of a high concentration of wealth does not imply that almost everyone has a capitalist ethos. It may be quite the opposite, and the ethos transition we have discussed may occur quite steadily with the incremental change in firm ownership and labor income that we have discussed. As people become more equal in material condition, they have more respect for others, and will be more likely to develop the trust that is necessary for the social ethos.
6. Challenging issues for social justice in the 21st century and beyond
Human behavior is diverse. The racism, xenophobia and nativism in many countries show both the need for the social ethos of solidarity and the potential challenges of acquiring it. Yet people have a high ability to cooperate with each other when the circumstances are right. Just look at the many peaceful areas of the world, the big cities, the large corporations, the voluntary organizations, the global markets, and all the other types of interaction and cooperation between strangers. In addition, in many countries citizens trust big governments and allow them to collect high taxes. The social ethos - the guiding belief in society - builds on this kind of trust, but it is more.
6.1 Can social ethos be imposed from above?
We have touched upon how social ethos of cooperation and reciprocation may lead people to contribute in the expectation that the other do the same. Such social ethos may be important for any alternative social arrangement, or economic system, that takes fairness seriously. For instance, this social ethos of cooperation and reciprocity was crucial for the development of the social and economic society model of Nordic countries. These countries are ranked favorably when it comes to economic and health security, productivity, and equality of income. Clearly there is no obvious way to characterize necessary conditions for the development of such a social ethos. It is also obvious that social ethos cannot easily be imported from one country to another.
The social ethos does not require a shared ethnic background and nationality. Neither does it require insulation from competitive pressure. On the contrary, there are clear and maybe surprising differences across countries in how citizens consider the importance of competition and free trade. The strength of a shared social ethos may depend on what else one is sharing. Having a comprehensive welfare state, for instance, means that the gains from trade are widely shared across members of society, implying that globalization meets less resistance. Without a welfare state, in contrast, the hostility towards globalization may easily become strong. This is indeed the pattern. The fraction of people who wants protection measures against foreign competition is as high as 61 percent in the US, but as low as 29 per cent in Sweden and 35 per cent in Denmark and Norway[18]. Thus compared to citizens in the US, the Nordic citizens have over time acquired much more of a shared belief about the benefits of protection without protectionism that is maintained in spite of changing color of the government, whereas beliefs in the US are more clustered on protection and protectionism being the same thing.
Also, if civic organizations are weak – in particular, trade unions – then capitalists have a relatively uncontested opportunity to develop a capitalist ethos in a nation. It is in their interest to have individuals worry only about their own material situation, not to organize with others for higher taxes, which will be paid disproportionately by the fairly rich, not to provide public goods, which the rich can relatively easily substitute for with their private wealth, not to demand higher wages, which directly reduce profits and the income of capitalists and large shareholders. As Margaret Thatcher said, “There is no such thing as society, only individuals and families,” a quite pithy statement of the premise of the capitalist ethos. There is no reason to believe that the individual preferences for having similar values as the rest of society are not equally strong in all countries. The difference stems from what kind of social ethos they adapt.
6.1.1 Values, development, and cultural change
To which degree can social ethos be thought of as an immutable characteristic of a population, or rather is molded by economic development, cultural change or social policies? To explore this we can look at large cross-national survey and experimental datasets that have been collected in the past decades such as the World Value Survey (WVS).
In seven waves started in 1981, the WVS has collected information on moral values, attitudes toward society, cultural and social norms, of citizens from about one hundred countries who represent, at the time of writing, 90% of the world population. The message that emerges from the analysis of these data, according to Inglehart and Baker (2000) and Inglehart and Welzel (2005), is surprisingly simple. It is at the same time a story of continuity and change.
Country-level cultural diversity can be accounted for by two simple dimensions. First, the “traditional values” dimension emphasizes the relevance, in the respondent’s life, of religion, paternalism in a child’s education, preference for large families and rejection of abortion, nationalism and authoritarianism in politics – which are a-critically accepted - and a pro-life stance on abortion, euthanasia and suicide. The waning of traditional values leads to the contextual emergence of “secular-rational” values, which are characterized by opposing views on the items just described.
Second, the “survival values” emphasizes the relevance, in the respondent’s life, of materialistic values - as engendered by attaching priority to economic and physical security –, existential insecurity driven by foreigners, ethnic diversity, and cultural change, intolerance toward homosexuals and other out-groups, insistence on traditional gender roles and political authoritarianism. People scoring high on the survival dimension are generally little trusting of others and unhappy with their lives. At the opposite size of this dimension there lie the emphasis on “self-expression”, which favors the replacement of concerns for one’s own material survival with the willingness to express one’s own individuality and autonomy, the tolerance toward out-groups and cultural change, the acceptance of non-traditional roles for women and the embracement of civic activism. Trust of others and high levels of subjective well-being contribute to the self-expression dimension. Such two dimensions correlate with a large array of other cultural and attitudes indicators, which denotes a surprising coherence across cultural traits.
Economic development exerts a massive effect on cultural change across the two dimensions described above. A first cultural shift took place as society switches from agriculture to manufacturing, associated with the waning of the traditional dimension and the emergence of secular-rational values. A second cultural shift took place as a society ends its industrialization phase and becomes predominantly post-industrial, associated with the survival dimension subsides in favor of the self-expression dimension accompanied by a strong demand for a country’s democratization.
More individuals require democratic institutions. As survival is no longer an immediate worry for most individuals people are more likely to choose forms of political institutions that are able to safeguard individual rights, rather than national interests.
A country’s cultural traits, as determined by its religious roots and political history, show strong degrees of persistence over time. The religious creed that has historically characterized a country, its political experience, and the specific historical trajectory, exert a long-lasting influence on the cultural traits. Several cultural areas can be identified according to this analysis: African-Islamic, Orthodox, Baltic, Confucian, South Asia, Latin America, Protestant, Catholic, English Speaking.
The pattern is shown in Figure 12 below. Scandinavian countries stand out as being those having at the same time the highest levels of secular values and self-expression. It is worth noting that while English-speaking countries, such as the US, have comparable levels of self-expression to the Protestant Europe area, they rank significantly lower under the secular dimension. At the opposite extreme of the chart there lie African-Islamic countries, where both traditional and survival values are widespread. Catholic Europe and South Asia show intermediate levels for either indicator. Finally, Confucian, Baltic and Orthodox countries tend to show high levels of secularity and relatively low levels of self-expression, while on the contrary Latin America ranks relatively high on self-expression but low on secularity. Overall, it is striking that these cultural areas identify rather homogenous clusters of countries. It is also interesting to note that countries having multiple religious confessions form unitary cultural wholes. For instance, Catholic Germans score at virtually identical levels as Protestant Germans under both the secular and the self-expression dimensions. (Inglehart and Baker, 2000). Germany stands in fact “at the border” with Catholic Europe in the map.

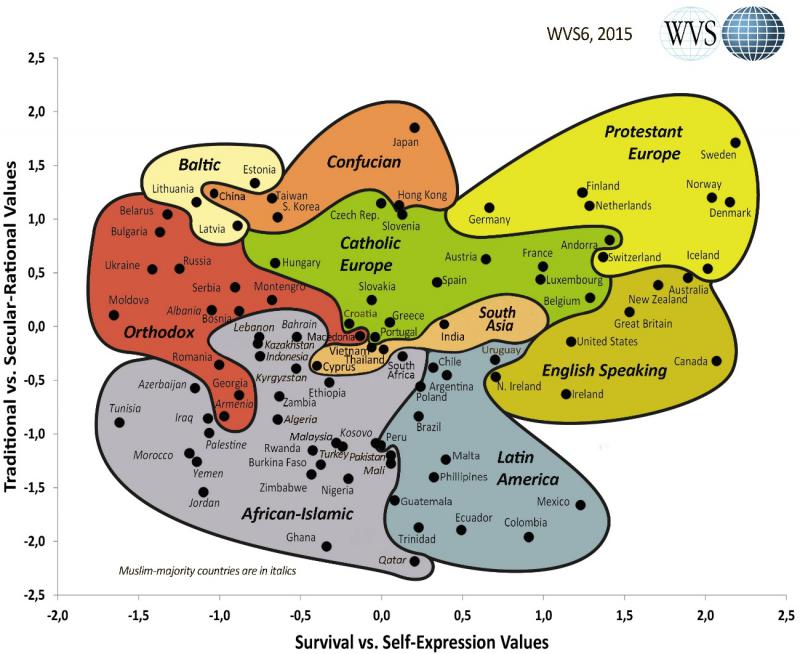
Source: World Value Survey website.
Figure 12: Relationship between cultural dimensions per group of countries
The longitudinal analysis of these two indicators show that countries experiencing economic development tend to shift from the south-west corner toward the north-east corner, as described above. Nevertheless, the process is path dependent, in the sense that a country’s starting point constrains the direction of cultural change. Rather than countries converging toward common cultural values, it is more appropriate to talk about countries moving in parallel.
The general picture that emerges is one that vindicates both Marxist theories of modernity and Weber’s claim of cultural determinism. Marx is proved right in predicting that the industrial revolution would have affected the cultural ethos of most societies embracing it. At the same time, Weber was also right in claiming the relevance of culture for socio-economic development. Inglehart stresses that these processes are not deterministic but are rather probabilistic.
Cross-country experimental evidence confirms that economic development is relevant not only for cultural change but also for individual propensity to cooperate with one another. Propensity to cooperate is highest among most globalized individuals living in the most globalized countries (Buchan et al., 2009). Since globalization is a close correlate of economic development and modernization, this evidence supports the view that economic progress goes hand-in-hand with behavioral norms that are functional to that very economic development. Experimental research has nonetheless also ascertained that culture maintains a considerable role in determining patterns of cooperation. Various locations used in a large-scale experimental study on patterns of cooperation (Hermann, Thoni and Gächter, 2008) cluster almost perfectly into the cultural areas identified by Inglehart and Welzel, 2005). (We review this evidence in an appendix at the end of the chapter).
6.1.2 A means for social progress?
If culture is so important in enhancing cooperation among individuals, can cultural or institutional change from outside shape the social ethos in a direction conducive to social progress? Even if no culture can claim superiority over the others, Inglehart and colleagues note that the transition from survival to self-expression values is in itself a form of social progress, because it permits individuals to become autonomous in the pursuit of their life plans. Drawing on Sen (2001), they call this process one of human development, because it permits the empowerment of individuals in their choices and in their life.
Non-Governmental Organizations have for instance advocated the necessity to instill forms of cultural change in connection with development aid programs. So-called community-driven development (CDD) programs seek to foster involvement of communities into the decisional process leading to the provision of public goods. In doing so, these programs also aim to create new social ties among community members, fostering social cohesion, trust, reciprocity and cooperation (Gossa, 2013, Putnam, 2000). CDD may be built on participatory processes rather than authority relations (King et al., 2010; Casey et al., 2012; Mansuri and Rao, 2013; Avdeenko & Gilligan, 2015). The World Bank provide on average 1.3 billion USD per year in loans to CDD over the last decade (IDA 2009).
Studies that have sought to assess the effectiveness of CDD programs doubt their capacity to bring about positive results. (Wong 2012 reviewed 14 CDD programs and find no appreciable impact on local social capital. Investigations on CCD programs in post-conflict found no effects – neither in Sudan (Avdeenko and Gilligan, 2015) nor in Sierra Leone (Casey et al., 2012), and only limited effects in Liberia and the Philippines, respectively (Fearon et al. (2009) and Labonne and Chase (2011)). Likewise, both international and governmental interventions had no effect on fostering social cooperation across Indian villages (Krishna, 2007). Conversely, social capital was indeed created by homegrown initiatives rather than external interventions. Overall, these findings seem to corroborate Elinor Ostrom’s view (2000) that social capital can be nurtured by self-organized locals, while international intervention has little or no impact.[19]
A more optimistic perspective comes from Ostrom (2000). Her main argument is that national and international authorities need to engage with local communities to make social capital emerge from within, rather than being instilled from outside. In this respect, providing opportunities for a community to become active and make decisions on specific projects financed from the outside, as many CDD programs do, may be an intelligent strategy.
For these programs to be successful local stakeholders must be given "voice and real responsibility", and not only be involved in short-term projects where they are largely “directed” by external authorities, then social capital becomes nothing more than a “shallow fad” (Ostrom, 2000: 201). Initiatives to mold a social ethos conducive to economic development and social progress effective must come from below.
Another possibility is to actively promote cultural exchanges across communities or countries. International fairs, events portraying typical aspects of a certain culture – such as for instance the Chinese new Year for Westerners - student exchange programs, the diffusion of culture-specific artworks, produces or services, or even tourism, are all examples of such cultural exchanges. This would have the merit to increase people’s awareness that alternative models of societal organization, ways to solve collective action problems, or simply different ways of thinking, exist, and may – or may be not – more effective in addressing the challenges with which a society may be faced.
Cultural exchanges should be seen as another form for letting social capital emerge as a bottom-up rather than a top-down approach. This may seem to re-propose new forms of cultural imperialism, because typically richest countries will have better means to diffuse their own culture. Nevertheless, state-driven cultural transmission is only one among many. The internet has proved to be an easily available instrument in this sense, and it may be argued that it has empowered people by giving them first-hand access to information not otherwise available.
All in all the existing empirical evidence on CDD indicate that the attempts to increase social capital from outside are bound to fail. Instead more attention should be devoted to the Ostrom-perspective of self-organization when communities are granted more autonomy and enhance cooperative values and setting their own goals.
6.2 What kind of system?
In our discussion of systems of economic, political and social organizations in the 20th century three experiments stand out: The first is the Soviet Union, which attempted for the first time in history a ‘dictatorship of the proletariat,’ a state supposedly controlled by ordinary working people rather than aristocrats or capitalists, but which failed to provide a good life for most people, due to the leadership’s fear of both markets and democracy (see section 3.2).
The third experiment is the Nordic social democracies, that emphasized a social ethos, through the social-democratic parties, and developed a great deal of citizen solidarity due in large part to powerful and centrally organized trade unions that were able to bargain centrally with capitalists, providing the most pervasive welfare states that we have seen, along with high labor productivity – but under conditions of smallness and homogeneity (see section 3.4).
There are of course many other interesting examples that we have briefly touched upon, and others again that are beyond our scope to explore in debt: northern Europe and Canada are capitalist countries, somewhere between the Nordics with their welfare states and high taxation and the United States, and with a social ethos that is less developed than in the Nordics. There is Singapore, a very small island state, an autocracy, but providing a high standard of living and economic security for its citizens (and Singapore is interesting because, unlike the Nordics, it has always been ethnically heterogeneous). There are South Korea and Japan, racially and linguistically homogeneous, and with an ethos that might be called Confucian: these countries have achieved rapid economic development. There is no country as egalitarian as Japan that is as large as Japan. (If we plot countries on plane whose two axes are ‘egalitarianism’ and ‘population size’ Japan is on the frontier of the plot.)
We have also discussed briefly the Chinese revolution, which after an initial period of 30 years of slow economic growth introduced markets, probably because they saw the great economic success of the other Asian tigers, with astounding results in the eradication of poverty and rapid growth in living standards, but also with extreme inequality of income and wealth, and the disappearance of the social ethos that probably characterized the early years after the revolution (see section 3.3).
Yet, we have not really evaluated China. The country stands as possibly the only successful socialist country in the world. But is it socialist? Is it a model for the future? China’s economy has socialist and capitalist features, so it is probably most accurate to say that it is neither capitalist nor socialist at present. It has a large sector of firms that are state-owned, and it has a large and rapidly growing sector of privately owned firms. The ethos in China is much closer to capitalist than socialist[20].
We do not have much information about the distribution of wealth in China, or the contribution of the state firms to the economy. Our prediction is that it will not develop in a progressive direction as long as it remains a political autocracy: there are not real trade unions, nor a significant number of civic organizations in China. Leaders pay lip service to Marxism, but lip service only. Still, China is a place where changes can take place rapidly, due to the thinking of a small collection of leaders. It is difficult to predict what will happen in China, how long it will remain a dictatorship, how it will face the problem of climate change, and so on. Despite what appears to be its failure as a socialist experiment, as evidenced by the disappearance of a social ethos, one must not underrate the achievement of the regime in transforming the economic conditions of the masses of people, something which democratic India has not accomplished.
From a scientific viewpoint, we do not possess sufficient evidence to decide how economic systems will evolve in the future, nor even how we would like them to evolve – that is, what variations from capitalism are feasible. We have seen:
- an experiment with political dictatorship and without markets, which failed in both economic provision and social ethos
- an experiment with political dictatorship, pervasive markets and public ownership, rapid economic growth, but the disappearance of socialist ethos, and rapidly growing concentration of income and wealth , and
- an experiment with social ethos, political democracy, and relatively egalitarian income distribution, but in small and homogeneous countries.
Given the failure of the first two experiments in producing what looks like the good society, and the possible irrelevance of the third experiment for most countries of the world that are considerably larger and more heterogeneous, what can we conclude? Is capitalism of the American variety, or perhaps the European variety of Germany or France or the UK, the necessary future of the world’s developing countries? Or the Confucian capitalism of Japan and South Korea? Or, something else?
6.2.1 The most important question
We cannot claim to have the answer what are the feasible economic systems for the world’s developing countries --- probably the most important question for social science of our time. But we can use economic theory and psychology to chip away at the problem.
A pessimistic view, different from the ones that dominates most of the discussion in this chapter, is based on the fact that the welfare state in the 20th century developed as a consequence of three catastrophes: the two world wars and the great depression. According to Piketty (2014), capital (wealth) was largely destroyed as a result of these catastrophes, and the period of the advance of welfare states coincided with the period when wealth concentration was lowest, and the wealthy were, one might conjecture, less powerful than they had been for centuries. Piketty suggests that we are returning to wealth concentrations that look like those of the late 19th and early 20th centuries -- a more extreme capitalism, where inheritance will become increasingly important as the manner of wealth transmission across generations. One might conclude that only another great depression or world war will bring about sufficient dissatisfaction with current arrangements to induce the kind of transformation we have discussed.
We honestly cannot say which of the two scenarios – the pessimistic or the optimistic-- is more likely: a rather gradual evolution of economic institutions, induced by social movements that occur in a time of peace, and whose victories are implemented through legislation, or rather rapid changes that occur as a result of catastrophes. The third possibility – that capitalism continues to become evermore venal, the concentration of wealth ever greater, the wealthy evermore isolated in their gated communities and private airplanes, with no financial crises sufficiently severe to induce mass social movements, we think is impossible. For such concentrations of wealth will breed capitalist classes with such power and greed that there will be either more financial crises and concomitant depressions, or the increased probability of a great war. One way or the other, capitalism as we now have it is not the end of history.
7. Toolkit for action
Table 8.1
| Goals/Values | Conjugating earnings equality and socio-economic progress. Implementing wage compression can stimulate a process of Schumpeterian ”creative destruction” that stimulates economic development at the same time safeguarding social equality. | Conjugating social justice with socio-economic progress. This will improve workers’ capabilities for every income levels, thus increasing their productivity. |
| Policy-Makers | Should foster a wage-setting system favoring wage compression and the reduction of skill premia. This will incentivize the replacement of low-paid jobs that use least-productive technologies with better-paid jobs that use most productive ones. As a result the average wage rate will increase. | Should implement welfare policies to provide social insurance, health services and education. By creating a safety net protecting against unemployment or food-shortages, policy-makers can also incentivize risk-taking in economic activities, thus fostering specialization and investment in skills and equipment. |
| International Organizations | One way to ensure wage compression is by increasing education levels, especially of people from the lowest economic brackets. International organizations may develop educational programs especially in developing countries. | Can accompany national governments’ action in providing social insurance against risks, health services and education. |
| NGOs | NGOs may have a role, alongside international organizations, in improving educational levels for people in the lowest economic brackets. | Can accompany national governments’ action in providing social insurance against risks, health services and education. |
| Citizens | Trade unions and entrepreneur organizations should comply with a policy of wage compression. This may be best achieved through a centralized system of wage setting. | Providing social safety nets will empower producers against land-owners, employers and the elites. |
.
8. Appendix
8.1 Productivity and social justice: lessons from the Nordic model for Latin America
The turn of the century has shown advances in social outcomes and public policies that for the first time provide a true window of opportunity for more productive and egalitarian societies in Latin America. Decreasing poverty, lowering income inequality, improved and expanded employment and access to transfers and services to popular sectors are indeed welcomed changes.
These outcomes have been dependent on five critical allies, some structural, some contingent and some policy dependent. In the first place, Latin America has experienced an excellent external context regarding the prices of its commodities and this has helped the economy and translated into employment. Secondly, as a positive legacy of the Washington Consensus era, prices have remained in most cases stable, thus gain in wages and transfers were not undermined by inflation. Thirdly, the state has increased its fiscal capacity and commitment to social policy almost doubling in 15 years real social per-capita expenditure. Fourthly, the demographic transition places most countries squarely within the demographic bonus when combined dependency ratios are lowest. Finally, education access, completion and credentials have improved in most countries of the region, allowing for enhanced opportunity and increased productivity.
Yet these five allies are likely to lose steam in the next couple of decades. First, growth will struggle to remain positive, but will in the best scenario be well below the levels seen in the past decade. Employment growth that accompanied economic growth will face bottlenecks if the trade-off between production and reproduction (wage work and household care and work) is not confronted. Secondly, most economies are facing increased inflationary pressures and the bonus that the first retreat of inflation provided to distributional outcomes will cease. Thirdly, with its present tax structures and in other cases productivity levels, social expenditure will not be able to increase at the rate of the last 15 years. Fourthly, the easy phase of the demographic transition (when dependency rates are going down) is likely to end in most countries around 2025. Dependency rates will remain in some cases low for a couple of decades, but will no longer diminish year after year. In other countries dependency rates will start to increase led by the growth of the older cohorts. Some countries in the region will face the European dilemma but with a lower GDP per-capita, namely, a weaker fiscal state and a more unequal society. Investing in younger cohorts, women and children becomes thus a necessity and a complex distributional challenge given the fact that the lion’s share goes usually to contributory –yet deficit ridden- pension systems that mostly cover the formal worker and are based on the idea of the male breadwinner model. Finally, while the soft targets of expanded education have been achieved (primary school and expansion of lower middle school), the tough ones remain: extended coverage in early childhood, completion of high school, quality improvement, and true reduction of inequality of outcome in learning.
There are five fault lines in Latin American social regimes that make these problems a major threat to the sustainability of both social and economic development. Firstly, women incorporation into the labor market remains low and stratified. This places a bottleneck in terms of the gains that can be made both in term of productivity and equality by the secular trends of women incorporation into the labor market. If the region is not able to overcome the 20% point gap in terms of women labor force participation, and, if that gap is due mostly to the fact that women from lower income strata cannot balance reproductive and productive work, then both equality and growth will suffer. The absence of a robust state led care system for early childhood and the persistence of a patriarchal distribution of care burdens undermines a route to development that is both more efficient and egalitarian. Secondly, Latin America remains a region with stark contrasts between insiders and outsiders in terms of the informal/formal labor markets and access to social protection and cash transfer systems. The political economy underpinning this distinction contributes to an expansionary monetary and fiscal policy in growth contexts that mainly benefits insiders and promotes inflationary pressures led by wages and social spending geared at insiders that are keen on protecting its private wage and unwilling to be taxed for redistributive public and collective goods and insurance. Thirdly, and partly dependent on the second fault line, the region´s middle class and new emergent class is not willing to increase taxation, since the quality of public goods and collective social services are not perceived as adequate for a race to middle class status. Fourthly, the pattern of fertility in Latin America shows some of the worst patterns expected in social terms. Countries move quite fast into low fertility scenarios, but do so based on a low-low fertility of the middle classes and a still moderately high fertility of the poor. Thus the demographic transition in the region is fast but not convergent. Most of the biological reproduction of society is thus left to the poor. This is partly due to the absence of universal social services and care systems for early childhood. Fifth: In a region that polarizes its fertility among income lines, it would be important to count on a state that equalizes opportunity early on and through the educational system. This is not the case. In contrast with OECD countries in which 50% of the consumption of children is provided by the state and 50% by the family of origin, in Latin America the data from the NTA project shows that 25% of children´s consumption is financed by the state and 75% by their family. In addition, regarding further educational attainment, PISA tests shows that European countries results are determined by family background to far lesser extent than in Latin American countries. Thus, in the most unequal region of the world with diminishing but non convergent fertility rates, where insiders have the upper hand in the political economic game of redistribution, the state is unable to equalize opportunity and promote equality. But in that failure, there is also a productivity failure, since underinvesting in the poor is underinvesting in the frontier of productivity enhancement.
It is in this context and these challenges that the possibility of a new social citizenship and a social investment model based on robust public goods, expansion of merit goods and universality of entitlements emerges. Yet it is not enough that elites are no longer able to control the political and economic game through status enclosure and authoritarianism. In order to craft truly universal social policies narrow corporatism and restricted targeting -and the political economy they sustain- have to be confronted as well. Contributory models based on formal wages and targeted social policies based on need will not disappear, but they have to take the back seat to a model of basic universalism where access to quality public and collective goods is truly universal, and entitlements in transfers and services are not dependent on need nor labor formality.
There are also five positive developments regarding these challenges. Firstly, there is a marked increase in non-contributory systems of cash transfers both in terms of pensions and child-family transfers. Secondly, there has been an important growth in public spending and access to education and educational achievement. Thirdly, policies regarding early childhood care and parental leave show a timid yet consistent advance. Fourthly, contributory models are being redefined in a fashion that attacks its contributory nature. Eligibility criteria are modified, making it more lax and the notion of equity based on contribution is being positively subverted by floors and ceilings. Finally, urban public goods such as security and public transport services have gained renewed importance as the emergent sectors enter the distributional arena.
Yet, these five positive developments are neither robust nor sustainable. They have been fueled by the commodity boom and the rise of the emergent and middle classes. A coalition that is willing to forgo private spending power in order to gain quality of life through collective services is needed. Such coalition is in the wings of these political, economic, and social epochal changes, but not, by far, guaranteed.
For this to happen at least three major changes or levers of change have to be put in place: i. a new fiscal contract that expands the tax base and at the same times redefines the drivers of the expansion of social public spending (from a cash transfer old age contributory model to citizen based services and cash transfers geared to women and child welfare), ii. The reforms of state civil service and the expansion and reforms in health care, education and care systems, increasing quality, efficiency and equity, and attacking both pure market oriented models and corporatist appropriation of the social service machinery, iii. The defense of collective and public goods. Collective goods such as urban transport and public spaces and public goods such as security have to be a priority, risking otherwise a continuous urban segregation that undermines equality and social cohesion.
Family transfers, care systems, full time schools, expanded father and mother leave at birth and strong investment towards security, public urban services and collective recreational services are the operational expression of this major thrust that is needed. Limits on subsidies for contributory stratified pension and health insurance systems and private education as well as on privatized systems of social insurance and urban mobility (through subsidies on gasoline and segregated urban developments) are part of what has to be confronted.
If this is achieved then a popular-middle class alliance can be forged; a distributional coalition that will in turn give political support and economic feasibility to a path of prosperity and increased equality of opportunity and outcome. If not, the promise will be shattered, and the pendulum between, on the one hand, failed populist, state led “robin hood” like incorporation attempts and on the other, technocratic closure of democracy, and state bashing will remain the central and tragic dynamic of the region.
8.2 Economic development, culture and cooperation: Experimental evidence
Cross-country experimental evidence confirms that economic development is relevant not only for cultural change but also for individual behavior in social interactions. We here focus on cooperation among individuals, because, as noted above, the propensity to cooperate with one another is a main indicator of the social ethos that seems to have been so important for the success of Nordic countries. Cooperation can come in different forms. We consider here a situation analogous to the “tragedy of the commons” scenario described by Hardin (1968), where an individual’s action set is the degree to which a common resource is exploited, and cooperation entails restraining from the exploitation that would be optimal from the individual point of view. That is, cooperators sacrifice their own material interests for the group’s greater good. The conclusion reached by Hardin is a pessimistic one. In the absence of an agency forcing individuals to restrain their own action, the outcome will be the depletion of the common resource. Nevertheless, cooperation is widespread in human societies. Having a dense social network can facilitate cooperation. Interactions become frequent and personalized, therefore the long-run incentives to comply with the cooperative norms outweigh the short-term interest to exploit the resource to the maximum possible degree. Moreover, with dense social networks individuals can acquire a reputation for complying with the cooperative norm. Individuals normally favorably reward others having a positive social image, so that cooperation can still be in one’s own long-term self-interest (Bolton et al., 2002; Seinen and Schram, 2006; Engelmann and Fischbacher, 2009). Nonetheless, individuals can be seen as cooperating even in ephemeral situations where future encounters can be ruled out and when the possibility of building a reputation is absent (Buchan et al., 2009). This type of cooperation can be considered as altruistic, because one’s own material resources are sacrificed to benefit others. It is on this, most difficult to achieve, type of interaction – cooperation with unknown others – that we focus here.
Buchan et al. (2009) investigated propensity to cooperate with unknown others in experimental interactions involving adults from six different countries – the US, Italy, Russia, Argentina, South Africa and Iran. The main research question was to understand the extent to which globalization, understood as large scale interconnectedness with others in the economic, social and cultural domain, is correlated with propensity to cooperate with others. Groups included some individuals from the same locality as the individual, and other individuals from other – unspecified – countries. Participants were endowed with some money, and could have either kept their money for their personal account or give the money to the group account, in which case the individual would lose out but others would benefit. The rules of the game were such that if every individual gave their money to the group account everyone would be better off in comparison to the situation of none giving. Yet, an individual could make even more money by keeping her endowment to herself, hoping to free ride on others’ contributions to the group account. Globalization was measured at the country-level, following the Globalization Index developed at the Centre for the Study of Regionalisation and Globalisation. A measure of individual globalization was also constructed out of the participants’ responses to a post-experiment questionnaire. Such an index sought to measure the frequency and scope of inter-personal connections that individuals had through their participation in global networks, such as the internet, global mass media and multi-national retail. Interactions were “one-shot”. The game was only played once, thus there was no interest to build a reputation or to construct a positive social image in the face of others. Difference in cooperative behavior across countries can truly be interpreted as reflecting individual compliance with country-specific cultural or moral norms, backed by trust in others or an obligation to give to global others.
The results were clear-cut. Country-level and individual-level measures of globalization went hand-in-hand in increasing individual propensity to cooperate with unknown others. Highest levels of cooperation were achieved by most globalized individuals living in the most globalized countries, and vice versa. Average cooperation rates ranged from 75% of the endowment in the US to 50% of the endowment in Iran. Interestingly, developing a global social identity (Buchan et al., 2011) appeared to be a mediating factor in the relationship between participation in global networks and cooperation. By global identity we mean one’s identification with the global community in terms of attachment, closeness and perceiving that the individual is a member of such a community. Typically, highly globalized individuals had also developed a strong sense of global identity. Globalization is a construct that is strongly correlated to economic development that featured so prominently in the analyses based on the WVS illustrated above. This study thus suggests that not only are cultural attitudes and values shaped by economic development, but also are individual behavior, and in particular their propensity to cooperate with one another.
The experimental cross-national study conducted by Herrmann, Thöni and Gächter (HTG) (2008) also found a close association between people’s propensity to cooperate worldwide and the results stemming from WVS analyses, but this time with regard to the cultural aspect rather than the economic development aspect. HTG focused on cooperation problems involving co-nationals only – university students in this case, coming from 17 different countries. The key research question was to study how cooperation rates may be increased if individuals participating in a cooperation problem similar to the one described above are given the possibility “to punish” each other. Punishment is costly to individuals. An individual must give up part of her endowment to reduce the earnings of another individual. Punishment is also anonymous and more costly for the individual being punished than the punisher, in a ratio of 3:1. Another key difference to Buchan et al. (2009) was given by the fact that interactions were repeated in this case over ten rounds.
HTG found substantial variation across countries in the capacity of groups to achieve high cooperation rates without punishment. In nearly all cases, however, a pattern of decreasing cooperation was observed in all locations. Cooperation rates normally started at around 50% of the endowment and gradually decreased to approach 10-15% in the last round. This result is not new and had emerged in nearly all problems of cooperation studied before. It had been explained in terms of either learning the “equilibrium” of the game, or in terms of the application of a reciprocity norm. What HTG observed in the cooperation problems with the possibility of punishment is nonetheless very different. In approximately half of the locations, introducing the possibility of punishment was capable of maintaining cooperation at fairly high levels. The reason is as follows. A portion of cooperators were willing to spend some of their endowment to punish those who did not cooperate. What is more, defectors, i.e. individuals disposed to free ride on others, realized that they could be punished with high probability had they not cooperated. It then became in their own interest to cooperate. In other words, individuals used punishment to endogenously enforce the cooperative norm. This result was not new. Fehr and Gächter (2002) had demonstrated the increase in efficiency in cooperation given by the introduction of punishment some years before.
The discovery of HTG was however that the possibility of enforcing cooperation through punishment is not universal. It only occurs in half of the locations. In the other half introducing punishment is actually detrimental. The reason is that people who are punished refuse to “behave themselves” in the next stage of the interaction. What they typically do is instead to counter-punish the person who (they believed) punished them previously. The punishment option therefore triggers a feud of retaliation and vengeance. Cooperation does not increase but rather remains stable. But the amount of resources spent on punishment dramatically decreases overall efficiency. This result is in itself ground-breaking and revealing of the relevance that culture has in shaping individual behavior. This so-called anti-social punishment has been found in a variety of societies (Beckman et al., 2002) and even in non-industrialized societies (Grimalda et al., 2016). Nevertheless, in a subsequent study, Gächter et al. (2010) were also able to pin down the specific cultural characteristics that are associated with such behavior. HTG demonstrated that the locations in which punishment works to enforce cooperative norms belong to three of the cultural areas identified by Inglehart and colleagues – namely, Protestant Europe, English speaking countries and Confucian countries. The areas where punishment does not work belong to Orthodox, Islamic and Mediterranean[21] countries. Importantly, the authors find little within-group variation but sizable between-group variation with respect to the cultural areas so identified.
These results point to the wide variety of culture-specific patterns of cooperation across the globe, and confirm that cooperation achieves much higher efficiency in specific cultural areas in comparison to others. It is still an open question why this is the case and which evolutionary processes have led to these outcomes.
References
Almås, I., Cappelen, A. W., Lind, J. T., Sørensen, E. Ø., & Tungodden, B. (2011). Measuring unfair (in) equality. Journal of Public Economics, 95(7), 488-499.
Attaran, A. (2005). An immeasurable crisis? A criticism of the Millennium Development Goals and why they cannot be measured. PLoS Med, 2(10), e318.
Avdeenko, A., & Gilligan, M. J. (2015). International interventions to build social capital: evidence from a field experiment in Sudan. American Political Science Review, 109(03), 427-449.
Barth, E. ans K.O. Moene (2015). The equality multiplier. How wage compression and welfare spending interact. The Journal of European Economic Association.(Forthcoming)
Barth, E., Finseraas, H., & Moene, K. O. (2015). Political reinforcement: how rising inequality curbs manifested welfare generosity. American Journal of Political Science, 59(3), 565-577.
Barth, E., Moene, K. O., & Willumsen, F. (2014). The Scandinavian model—an interpretation. Journal of Public Economics, 117, 60-72.
Beckman, S. R., Formby, J. P., Smith, W. J., & Zheng, B. (2002). Envy, Malice and Pareto efficiency: An experimental examination. Social Choice and Welfare, 19, 349–367.
Bolton, G. E., Katok, E., & Ockenfels, A. (2002). How effective are online reputation mechanisms? An experimental investigation. In Management Science.
Boulding, K.E. (1962) Social justice in social dynamics. In: Brandt RB (ed) Social justice. Prentice Hall, Englewood Cliffs, N.J., pp 73–92
Bowles, S., & Gintis, H. (1993). The revenge of homo economicus: contested exchange and the revival of political economy. The Journal of Economic Perspectives, 7(1), 83-102.
Brunori, P., Ferreira, F. H., & Peragine, V. (2013). Inequality of Opportunity, Income Inequality, and Economic Mobility: Some International Comparisons. In Paus, E. (ed.): Getting Development Right (pp. 85-115). Palgrave Macmillan US.
Buchan, N., Brewer, M., Grimalda, G., Wilson, R., Fatas, E. and Foddy, M. (2011). “Global Social Identity and Global Cooperation”, Psychological Science, 22(6): 821-828.
Buchan, N., Grimalda, G., Wilson, R., Brewer, M., Fatas, E. and Foddy, M. (2009): “Globalization and Human Cooperation”, Proceedings of the National Academy of Sciences of the USA, 106 (11): 4138-4142.
Cappelen, A. W., Moene, K. O., Sørensen, E. Ø., & Tungodden, B. (2013). Needs versus entitlements—an international fairness experiment. Journal of the European Economic Association, 11(3), 574-598.
Cappelen, Alexander W., Erik Ø. Sørensen, Bertil Tungodden (2010) Responsibility for what? Fairness and individual responsibility, European Economic Review (54), 429–441.
Cappelen, Alexander, Astri D. Hole, Erik Ø. Sørensen and Bertil Tungodden (2007). ‘The Pluralism of Fairness Ideals: An Experimental Approach', American Economic Review, 97(3): 818-827.
Casey, Katherine, Rachel Glennerster, and Edward Miguel. 2012. “Reshaping Institutions: Evidence on Aid Impacts Using a reanalysis Plan.” Quarterly Journal of Economics 127: 1755–812.
Dasgupta, P., & Ray, D. (1987). Inequality as a Determinant of Malnutrition and Unemployment: Policy. The Economic Journal, 97(385), 177-188.
Dreze, J. & R. Khera (2015). Readings in Social Policy and Public Action, unpublished compilation. http://hss.iitd.ac.in/faculty/reetika-khera
Durante, R., Putterman, L., & Weele, J. (2014). Preferences for redistribution and perception of fairness: An experimental study. Journal of the European Economic Association, 12(4), 1059-1086.
Engelmann, D., & Fischbacher, U. (2009). Indirect reciprocity and strategic reputation building in an experimental helping game. Games and Economic Behavior, 67(2), 399-407.
Fearon, James, Macartan Humphreys, and Jeremy Weinstein (2009). “Development Assistance, Institution Building and Social Cohesion after Civil War: Evidence from a Field Experiment in Liberia.” American Economic Review: Papers & Proceedings 2009, 99:2, 287–291
Fehr, E., & Gächter, S. (2002). Altruistic punishment in humans. Nature,415(6868), 137-140.
Ferguson, A. 2009 “Feminist Paradigms of Solidarity and Justice” Philosophical Topics 37 (2):161-177.
Francesco Farina & Gianluca Grimalda, 2011. "A cross-country experimental comparison of preferences for redistribution," Department of Economic Policy, Finance and Development (DEPFID) University of Siena 0211.
Frohlich, Norman; Joe A. Oppenheimer, and Cheryl L. Eavey (1987). “Laboratory Results on Rawls’s Distributive Justice,” Britisj Journal of Political Science. 17, 1–21.
Gächter, S., Herrmann, B., & Thöni, C. (2010). Culture and cooperation. Philosophical Transactions of the Royal Society B: Biological Sciences, 365(1553), 2651-2661.
Gibson-Graham, J.K. 2003 “Enabling Ethical Economies: Cooperativism and Class” Critical Sociology 29 (2): 123-161
Gibson-Graham, J.K. 2006 A Postcapitalist Politics Minneapolis: University of Minnesota Press
Gibson-Graham, J.K.. Cameron J. and Healy, S. 2013 Take Back the Economy: An Ethical Guide For Transforming Our Communities Minneapolis: University of Minnesota Press
Gossa, Endeshaw Tadesse. 2013. Sudan - Community Development Fund : P094476 - Implementation Status Results Report: Sequence 10. Washington, DC: World Bank.
Grimalda, G., Pondorfer, A., Tracer, D. (forthcoming). Social image concerns promote cooperation more than altruistic punishment; accepted for publication in Nature Communications.
Guiso, Luigi, Paola Sapienza, and Luigi Zingales (2006), “Does Culture affect Economic Outcomes?,” Journal of Economic Perspectives, 20(2): 23-48.
Hardin, G. (1968). The tragedy of the commons. science, 162(3859), 1243-1248.
Herrmann B, Thöni C, Gächter S (2008) Antisocial punishment across societies. Science 319: 1362-1367.
Hooks, B. 1984 “Sisterhood: Political Solidarity Between Women” In Feminist Theory from Margin to Center ed. bell hooks. Boston: South End Press.
IDA. 2009. “IDA At Work Community-Driven Development: Delivering the Results People Need.” International Development Association.
Inglehart, R., & Baker, W. E. (2000). Modernization, cultural change, and the persistence of traditional values. American sociological review, 19-51.
Inglehart, R., & Welzel, C. (2005). Modernization, cultural change, and democracy: The human development sequence. Cambridge University Press.
King, Elisabeth, Cyrus Samii, and Birte Snilstveit. 2010. “Interventions to Promote Social Cohesion in Sub-Saharan Africa.” Journal of Development Effectiveness 2: 336–70.
Kluegel, James R. and Eliot R. Smith. (1986). Beliefs About Inequality: Americans’ Views of What Is and What Ought To Be. NY: Aldine De Gruyter.
Konow, J. (1996). A positive theory of economic fairness. Journal of Economic Behavior & Organization, 31(1), 13-35.
Konow, J. (2003). Which is the fairest one of all? A positive analysis of justice theories. Journal of economic literature, 1188-1239.
Krishna, Anirudh. 2007. “How Does Social Capital Grow? A Seven-Year Study of Villages in India.” Journal of Politics 69: 941–56.
Labonne, Julien, and Robert S. Chase. 2011. “Do Community-Driven Development Projects Enhance Social Capital? Evidence from the Philippines.” Journal of Development Economics 96: 348–58.
Lind, Jo Thori and Karl O. Moene (2011) "Miserly Developments", Journal of Development Studies Vol. 47 No. 9, pages 1332-1352.
Lindert, P. H. (2004). Growing public: Volume 1, the story: Social spending and economic growth since the eighteenth century (Vol. 1). Cambridge University Press.
Mansuri, Ghazala, and Vijayendra Rao. 2013. Localizing Development: Does Participation Work? Washington, DC: World Bank.
McCloskey, Herbert and John Zaller (1984). The American Ethos: Public Attitudes Toward Capitalism and Democracy. Cambridge, MA: Harvard U. Press.
Mikula, G. (1980). Justice and social interaction: Experimental and theoretical contributions from psychological research.
Milanovic, B. (2015). Global Inequality of Opportunity: How much of our Income is determined by where we live?. Review of Economics and Statistics, 97(2), 452-460.
Milanovic, B. (2016), “Global inequality: a new approach for the age of globalization”. Cambridge, MA: The Belknap Press of Harvard University.
Moene (2011) “The moral sentiments of Wealth of Nations," The Adam Smith Review ,volume 6.
Moene, K. O. (1992). Poverty and landownership. The American Economic Review, 52-64.
Moene, K. O., & Wallerstein, M. (2001). Inequality, social insurance, and redistribution. American Political Science Review, 859-874.
Moene, K. O., & Wallerstein, M. (2003). Earnings inequality and welfare spending. World Politics, 55(4), 485-516.
Moene, K. O., & Wallerstein, M. (2003). Targeting and political support for welfare spending. Also printed in Conflict and Governance (pp. 33-54). Springer Berlin Heidelberg.
Nutall, G. 2012 Sharing Success: The Nuttal Review of Employee Ownership UK Department for Business, Innovation and Skills.
Nyssens, M. 2006 Social Enterprise: At the Crossroads of Market, Public Policies and Civil Society London and New York:; Routledge.
Osberg, L and T. Smeeding (2006). “Fair” Inequality? Attitudes toward Pay Differentials: The United States in Comparative Perspective”, American Sociological Review, 450-473.
Ostrom, Elinor. (2000). Social Capital: A Fad or a Fundamental Concept? In Social Capital: A Multifaceted Perspective, eds. Partha Dasgupta and Ismail Serageldin. Washington, DC: World Bank, 172–214.
Piketty, T. (2014). Capital in the twenty-first century. Harvard University Press.
Pogge, T. 2002. World Poverty and Human Rights Cambridge UK: Polity Books.
Putnam R (2000). “Bowling alone: the collapse and revival of American community”, New York: Simon and Schuster.
Redondo, G., Santa Cruz, I. and Rotger, J.M. 2011 “Why Mondragón? Analyzing What Works in Overcoming Inequalities” Qualitative Inquiry 17, 3: 277-283
Rip, A. and Kemp, R. 1998 “Technological change” Chapter 6 in Human Choice and Climate Change Vol 2 Resources and Technology Edited by S. Rayner and E.L.Malone. Colombus, Ohio: Batelle Press
Schildberg-Hörisch, H. (2010). Is the veil of ignorance only a concept about risk? An experiment. Journal of Public Economics, 94(11), 1062-1066.
Schokkaert, E., & Capeau, B. (1991). Interindividual differences in opinions about distributive justice. Kyklos, 44(3), 325-345.
Seinen, I., & Schram, A. (2006). Social status and group norms: Indirect reciprocity in a repeated helping experiment. European Economic Review,50(3), 581-602.
Sen, A. (2001). Development as freedom. Oxford Paperbacks.
Serageldin, I. (1998). The initiative on defining, monitoring and measuring social capital: overview and program description. Social capital initiative. Papeles de trabajo Nº1, Banco Mundial.
Shapiro, C., & Stiglitz, J. E. (1984). Equilibrium unemployment as a worker discipline device. The American Economic Review, 74(3), 433-444.
Singh, P. 2010 “We-ness and Welfare: A Longitudinal Analysis of Social Development in Kerala, India” World Development 39, 2: 282-293
Smith, Adam (1776). An Inquiry into the Nature and Causes of the Wealth of Nations, The University of Chicago Press, Chicago.
Traub, Stefan and Christian Seidl, Ulrich Schmidt, MariaVittoria Levati (2005). Friedman, Harsanyi, Rawls, Boulding – or somebody else? An experimental investigation of distributive justice. Social Choice and Welfare, 24: 283–309.
Waring, M. 1988 If Women Counted New York: Harper and Row.
Wong, Susan. 2012. What Have Been the Impacts of World Bank Community-Driven Development Programs? CDD Impact Evaluation Review and Operational and Research Implications. Washington, DC: World Bank.
Young, I. M. 1990 Justice and the Politics of Difference Princeton N.J.: Princeton University Press.
Young, I.M. 2000 Inclusion and Democracy New York: Oxford University Press.
Layard, P. R., & Layard, R. (2011). Happiness: Lessons from a new science. Penguin UK.
[1] Affiliations : IfW, Germany ; University of Oslo, Oslo, Norway
[2] Affiliations : Hitotsubashi University, Japan ; CIESU, Urugay ; Yale University, USA ; SEWA, India ; University of West Sydney, Australia ; Brookings, USA
[3] See Moene (2011) for a discussion of Adam Smith as a social democrat “The moral sentiments of Wealth of Nations," The Adam Smith Review ,volume 6) and Moene &Wallerstein, 2006, on social democracy as a development strategy more generally.
[4] E. Hobsbawm, 1994. The age of extremes: A history of the world, 1914-1991 (New York:Pantheon)
[5] The OECD comprises the 34 most economically developed countries of the world. The least developed of the OECD countries is probably Mexico.
[6] These figures are from Thomas Piketty (2014), Capital: In the 21st century (Harvard University Press) and other more recent publications of Piketty.
[7] The main competitors to the Bolsheviks in the Duma were other socialist parties. Lenin feared the Bolsheviks could not defeat them in the Duma, and hence some kind of coalition government would be necessary. He preferred the option of dictatorship by the Bolsheviks, doubtless underestimating the importance of political competition in keeping leadership attuned to the interests of the citizenry.
[8] There was indeed a period, beginning in 1921, called the New Economic Policy (NEP) when Lenin did introduce markets and limited capitalism because the economy was in such dire straits after the civil war in Russia. Lenin died in 1924 and Stalin terminated the NEP in 1928. Had that not occurred, it is possible the Soviet Union would have developed as a market–socialist economy (or perhaps made a transition back to capitalism).
[9] Liberman published his first proposals for market reforms in 1962. The earliest English language statement seems to be E. Liberman, 1972, Economic methods and the effectiveness of production, White Plains NY: International Arts and Sciences Press. Of importance is also Leo Kantorovich, the Soviet mathematician who won a Nobel prize in economics for development of the simplex method, a method for solving complicated mathematical programming problems. Kantorovich advocated using mathematical methods of planning that involved computing ‘shadow prices’ of commodities. According to the historical novel Red Plenty (Francis Spufford, 2010, London: Faber and Faber), he believed that mathematical programming could achieve a level of efficiency in central planning that was similar to that achieved by markets.
[10] In 1960, Conservative British Prime Minister Harold Macmillan concluded, “They [the USSR] are no longer frightened of aggression. They have at least as powerful nuclear forces as the West. They have interior lines [of communication]. They have a buoyant economy and will soon outmatch capitalist society in the race for material wealth [Tony Judt [2005, p. 248]].”
[11] This fact is not inconsistent with the earlier mentioned fact that the huge growth of Chinese incomes has lowered inequality globally.
[12] See The New Yorker article “China’s butler boom: Service in the style of ‘Downton Abbey’ has taken hold among Chinese elite.” (The New Yorker, October 2, 2015.)
[13] Between the first and the second world war Sweden, Norway and in part Denmark had the world record in strikes and lockout measured by lost working days. Finland had a civil war in 1918 between the Reds, led by the Social Democratic party and the Whites, led by the conservative-led Senate. Almost 40 thousand people died. The war divided Finland politically for many years.
[14] He expressed a synthesis of his ideas and a founding document of CEPAL in The Economic development of Latin America and its Principal Problems (New York; United nations, 1950).
[15] If we compare the ISI rates of growth with the WC rates of growth there is no dispute. ISI was better. The only country that showed positive results in average well-being, though not in social justice, was Chile, the darling of the Chicago Boys and its most consistent follower. This does bring to the fore the issue of efficiency in today´s world and the relevance of market dynamics to foster such efficiency.
[16] In the United States, when stock passes down at death to an heir, there is no tax on the capital gains that occurred during the deceased’s lifetime. If the stock is later sold by the heir, the capital gains are evaluated as the stock’s increase in value only since the death of the previous (now deceased) owner. This is called the ‘step-up in basis’ rule.
[17] Walmart’s annual sales are $480 billion, so H is not at the very top.
[18]See Melgar N., J. Milgram-Baleix, and M. Rossi (2013). Explaining Protectionism Support: The Role of Economic Factors, ISRN Economics Volume 2013 (2013), Article ID 954071, http://dx.doi.org/10.1155/2013/954071
[19] Only the crumbling remains of poorly maintained ...facilities are left today in many countries for all the billions
invested. There is a serious need to rethink the overemphasis on physical capital alone. The recent groundswell
of attention in the development literature on social capital is a refreshing and needed change (Ostrom, 2000: 172-3).
[20] Macfarquar and Schoenhals (2006) believe the socialist ethos in China was destroyed by the Cultural Revolution (1966-1976), because of which the population lost faith in the Communist Party’s ability to lead. The second catastrophe for the socialist ethos was the brutal, military squashing of the demonstrations in Tiananmen square in 1989. Because of both episodes, the socialist ethos was lost because the population identified socialism with the Communist Party, which committed these gross errors.
[21] It can be noticed that the category of “Mediterranean” country that HTG introduced does not match Inglehart’s original classification. In fact, the two countries comprising the “Mediterranean” group in HTG are Greece and Turkey. The former should then be subsumed into the “Orthodox” category, while Turkey has been included in the Islamic category. Nothing relevant of HTG’s conclusions would be lost applying this alternative classification.
The commenting phase has been concluded. We thank you for your thoughtful comments and responses.